Today I'd like everyone to welcome back Dr. Barry Burns. He was a guest blogger a few weeks back and the overwhelming response was "we want him back"! So you asked for him, I called in a personal favor, and here he is again to help teach us.
================================================================
Traders who use technical analysis rely on charts to help establish a probability scenario for entering a trade.
We generally look at 3 things:
Price patterns.
Volume patterns.
Indicator patterns.
There have been countless books written and courses sold on how to use these things to predict future market movement. Despite this, countless traders continue to fail in their attempts to become profitable.
Why?
After years of watching my father trade (he had 70 years of experience in the markets) and many years of my own experience, I’ve come to this conclusion:
None of it works!
That’s right. I haven’t found a single price pattern or indicator that could accurately predict the future of the market with enough probability to make any money.
So, is technical analysis an exercise in futility?
Although I haven’t found any one single thing to prove profitable, favorable probability scenarios can be found by combining several indicators. However this has to be done in the right way.
I identify what I call the “energies” of the market, and have selected certain indicators to measure those energies.
5 of the energies are:
Trend.
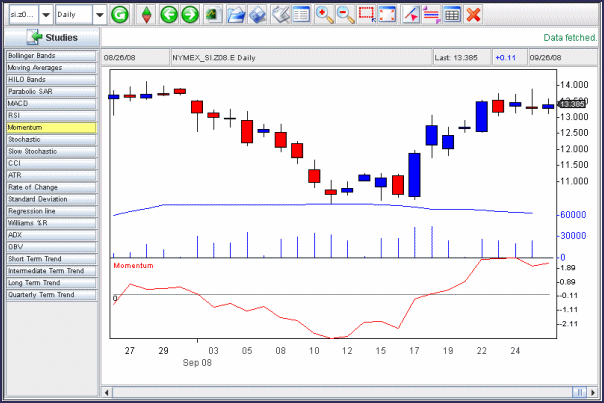
Momentum.
Cycles.
Fractals.
Blockages.
The key to success is to wait until all 5 of these energies align telling you the same thing (“go long” or “go short”) at the same time.
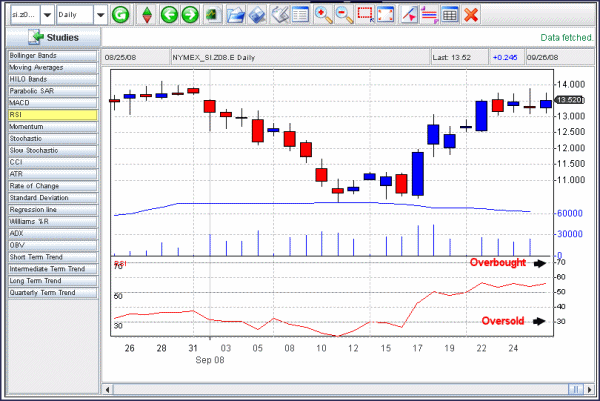
Indicators measure these energies. Again, I don’t have much confidence in any single indicator. After all, they only do what their name says: They “indicate;” they don’t “tell” you what the market will do next.
However, when all 5 indicators align, and they each measure a different energy, then this is a time when the probability is now on your side.
You can even use this to “score” a trade on a scale of 1-5 depending on how many “energies” (indicators) align in the same direction.
You may choose to be very conservative and only take trades that are very high probability – so you’ll wait until all 5 energies align. The downside of this is that it doesn’t occur very often and therefore you won’t be very active in your trading.
You may decide you need more trades to be psychologically satisfied and keep your interest and focus on the market. In this case you could take trades that rate a 4 (4 of 5 energies align in the same direction at the same time). You will get more trades, but your
win/loss ratio will be slightly lower.
You can choose your favorite indicators to measure these 5 indicators. Which ones you use isn’t the most critical factor … as long as you know how to use them properly.
Using this approach gives you a very measurable and objective way to make decisions and track your trades.
BIO:
Dr. Barry Burns is the owner of Top Dog Trading which teaches people how to avoid the long learning curve in day trading, swing trading and investing.
He started his study of the markets under the direction of his father, Patrick F. Burns, who became independently wealthy through trading and had over 70 years of trading experience before passing away in 2005.
He has been the featured speaker at DayTradersUSA, and developed a 5 Day Course for WorldWideTrders.
Dr. Burns has been a headlining guest speaker for the Market Analysts of Southern California, given seminars around the country at many Wealth Expos as well as many Traders Expos, been interviewed on the Robin Dayne "Elite Masters of Trading" Radio Show, and is the former moderator of the FuturesTalk chat room.
He has a doctorate in Hypnotherapy and is a certified NLP practitioner, and therefore able to help people with the psychology of trading.


 Before Michael Mazur began trading in the futures industry in 1994, he spent ten years as an international cargo trader in the energy market. He traded for Mobil Oil, Mitsubishi, Salomon, and Vitol SA, and he managed trading personnel and a trading portfolio that reached from the Arabian Gulf through India to the Pacific Rim. His group sales ranged from $500 million to $1 billion annually. Michael lives in Pacific Grove, California, where he operates M.J. Mazur, Inc., a registered commodity trading advisor. Michael manages futures accounts, publishes M Trade, a daily trading sheet, and provides consulting services to institutions and independent investors.