
By: Chris Wilkinson of Longleaftrading.com
Corn has been in an upward trend since it put in its lows at the beginning of October. From there the chart has traded a series of measured Fibonacci levels all the way into profit targets each time. Last week's correction brings us right at the next Fibonacci sequence to take a long position and stick with this trend.
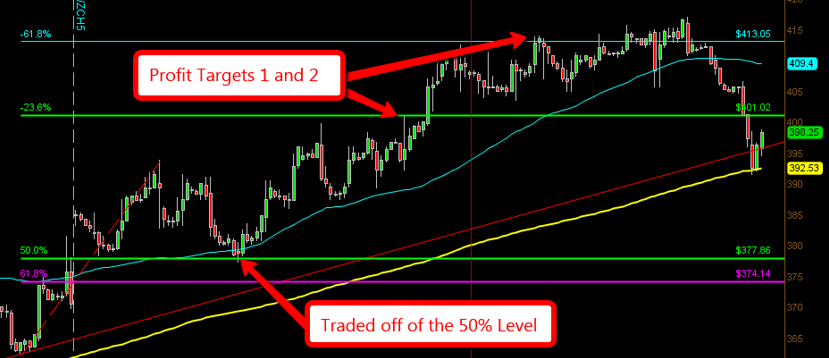
For a review of the previous Fibonacci sequence that traded into profit targets we draw the Fib tool from the lows of November 19th (362.5) up to November 28th highs (393.75). With this drawn you can see the market pulled back and found support right on the 50% level and traded directly into its first and second profit targets, the -23.6% Fib level and the -61.8% Fib level. See the Chart below.
4 Hour Chart Corn
Now that the previous move has corrected we continue to draw the next series until we get to one that fails the 61.8% level. A failure happens when we get a strong close on a large time candle. An hourly close or higher is sufficient to call it a failure. Normally smaller time frames will trade back and forth around those levels so I look to larger time frames for confirmation. If a failure happens it is assumed the trend is over and the next one begins in the opposite direction.
The next move found by using the Fibonacci tool is drawn from the support of the previous move. We use the lows of December 3rd (377.25) and draw it all the way up to the new highs on December 29th (417). See Chart Below.
4 Hour Chart Corn
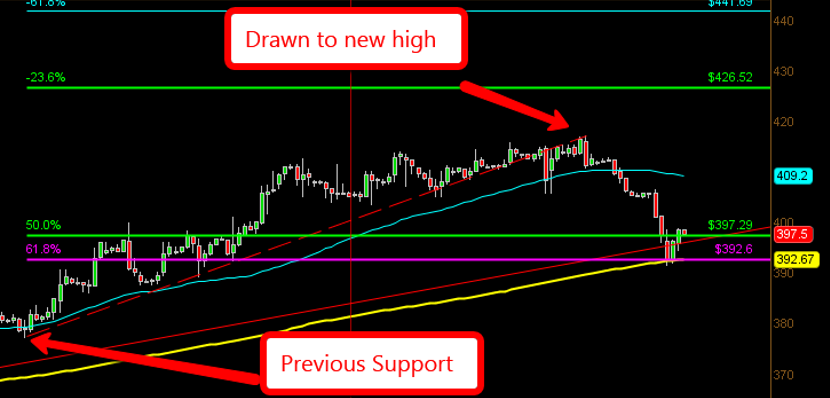
You can see after drawing the tool this way that we are currently trading in the area that gives us our entry. The trade is placed for a long position at or near the 50% level and risking below the 61.8%. If you place a limit order at the 50% level (397.25) and risk below the 61.8% level (let’s say 388.25) you risk $.09 to get to the first profit target at $426.25, for a potential gain of $.29.
There are many different ways to apply the Fibonacci tool and it will take some experience to learn what levels to draw them from. The application shown for this trade setup is known as a "Traditional Measured Move". It is a traditional measured move because you simply draw the series from previous lows to new highs. These are considered the most reliable and what I use most often to time entries. The Fibonacci tool can be applied several different ways allowing for a lot of discretion involved in determining what levels to use when drawing the Fibonacci. Because of this uncertainty, I look for areas of confluence for additional conviction. The idea being that if traders are ignoring the Fib levels, there will be other supportive technical analysis in play.
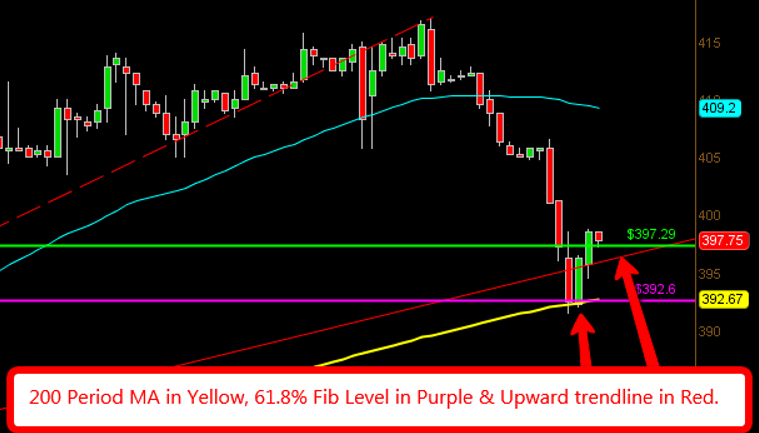
You can see several different things going on at the current trading levels. I have a trend line drawn from the lows of October 1st to the lows of November 19th. The market traded below this trend line but closed the week above it. You will also notice a 200 period moving average on the 4 hour chart being supportive. This is also in confluence of the 61.8% level of this Fibonacci sequence. A daily candle shows a pin bar at these levels which provides further conviction. Let's not also forget about our round numbers. The Market is trading around $4 even. Closing above $4 on an hourly chart or higher would give me even further conviction that we should see our first profit target being hit at the -23.6% Fib level (426.5). All of these combined makes for a high probability trade setup to get long exposure. If it fails below Fridays lows there is strong evidence that the market would see a larger correction to the downside after brushing off all of the support we see here. See chart below for a closer look at the confluence at these levels.
4 Hour Chart Corn
With the idea that less acreage will be used for planting corn this year and already being in an upward trending market I am going to stay bullish. The series of Fibonacci sequences have continued to provide support and are currently respecting the next move higher. The combination of several different technical indicators are also providing a strong case to get long. If you are bear I would consider waiting to see trading below Fridays lows (391.5).
The Fibonacci strategy I used here provides very specific entry and exit points. It is possible to apply on all markets to help find higher probability trades. If you would like to discuss any of the following you can reach me at 888-272-6926 or e-mail at CW********@lo*************.com. I look forward to speaking with you and assisting you with your trading objectives.
** There is a substantial risk of loss in trading futures and options. Past performance is not indicative of future results. The information and data contained in this article was obtained from sources considered reliable. Their accuracy or completeness is not guaranteed. Information provided in this article is not to be deemed as an offer or solicitation with respect to the sale or purchase of any securities or commodities. Any decision to purchase or sell as a result of the opinions expressed in this article will be the full responsibility of the person authorizing such transaction.
As I suspected, Corn today issued a SELL SIGNAL following an OUTSIDE DAY, a day of indecision and along with that
the Daily Bands are diverging suggesting further lows are ahead.
I only utilize the Daily Chart for my Technical Analysis and as I see it, Corn has had a nice move up from it's low @ 330.50, to a high of 417.0. Looks like Dec 30 it incurred a sale signal from MACD and has a retracement at 71%, followed by 2 down days. I would expect a decent correction off it's latest high/low before any further advancement, which could possibly be several days worth. I will say this though, the Monthly Lower Band, is rising, the Weekly Bands are diverging and the Daily Lower band is rising as well, so long range it appears Corn will rise barring a major event, but I wouldn't anticipate anything right away, Corn still has a few technical hurdles in my view.
Don't ignore the dollar. If the DX keeps climbing > 95, which it just might, we'll see a dip, again, in most commodities -- like corn.
Historic historic advance up in natural gas 5 to 9 possible
Very Good .