Bullish Pattern Spotted for Two Agricultural Futures

There is an interesting bullish pattern popping up in the agricultural markets. It's a pattern I spotted in gold in February, but now I've found it in at least two agricultural markets.

Soybean Futures - Cup & Handle

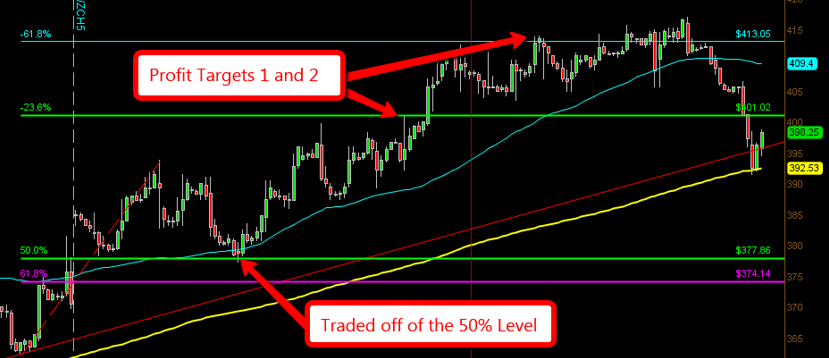
Let's start with a soybean futures chart.

The soybean futures price hit an all-time high of $17.89/bushel in September 2012. After that, it started to collapse in several legs to the downside, losing half of its price by September 2015. Continue reading "Bullish Pattern Spotted for Two Agricultural Futures"

Chart of The Week - Corn to Move Higher

By: Chris Wilkinson of Longleaftrading.com

Corn has been in an upward trend since it put in its lows at the beginning of October. From there the chart has traded a series of measured Fibonacci levels all the way into profit targets each time. Last week's correction brings us right at the next Fibonacci sequence to take a long position and stick with this trend.

For a review of the previous Fibonacci sequence that traded into profit targets we draw the Fib tool from the lows of November 19th (362.5) up to November 28th highs (393.75). With this drawn you can see the market pulled back and found support right on the 50% level and traded directly into its first and second profit targets, the -23.6% Fib level and the -61.8% Fib level. See the Chart below.

4 Hour Chart Corn

Now that the previous move has corrected we continue to draw the next series until we get to one that fails the 61.8% level. A failure happens when we get a strong close on a large time candle. An hourly close or higher is sufficient to call it a failure. Normally smaller time frames will trade back and forth around those levels so I look to larger time frames for confirmation. If a failure happens it is assumed the trend is over and the next one begins in the opposite direction.

The next move found by using the Fibonacci tool is drawn from the support of the previous move. We use the lows of December 3rd (377.25) and draw it all the way up to the new highs on December 29th (417). See Chart Below. Continue reading "Chart of The Week - Corn to Move Higher"

Today's MarketClub TV: Why Commodity markets are so important and deserve a spot in your portfolio

Hello traders everywhere! Adam Hewison here, co-founder of MarketClub with MarketClub TV for Wednesday, the 20th of February.

WHY COMMODITY MARKETS ARE SO IMPORTANT
The commodity markets are incredibly important as they really drive commerce and the economy. Think of the role that commodities play in our everyday lives, they affect the cost of what we eat, what we buy and how we drive to and from work. In today's show, we will be looking at the major trends in all of the major commodity markets.

THE WORLD CUP PORTFOLIO
Five years ago, we began the World Cup portfolio using core commodity markets. Five of the six components that make up the World Cup portfolio are pure commodity plays-wheat, corn, soybeans, gold and crude oil. The sixth element is the Dollar Index. Here are the theoretical returns for the World Cup portfolio starting in 2008: Continue reading "Today's MarketClub TV: Why Commodity markets are so important and deserve a spot in your portfolio"

Commodity Chart of The Week

Each week longleaftrading.com will be providing us with a commodity chart of the week as analyzed by a member of their team. We hope that you enjoy and learn from this new feature.

Often times it is easy to get carried away with looking at what is front of us to forget what is around us.  Let’s begin this today acknowledging the price action of late in the corn market has been lackluster at best.  After such a robust market move this summer, where we saw record corn prices at $8.41/bushel’ the market has been consolidating that move since.  The threat of the extreme dryness ended as we moved into harvest in the late fall and that sent a huge percentage of long specs to the sidelines.

We now sit at $6.85/bushel and most of the news flow remains negative.  Commercials are not anxious buyers of corn and the demand numbers of late have been week.  Calendar spreads (March/May) do not provide elevators an incentive to sit on their stocks looking for a time to sell in the future.  This has pushed a lot of grain forward to the cash market, suppressing the price.

Weekly export sales have also been very slow.  Last week came in at 49,100.  Because the market needs to see sales at 464,000 tonnes to reach the USDA forecast, this leaves the market in need of a lot of foreign buying to get back on track to meet that forecast. Continue reading "Commodity Chart of The Week"

5 Years of Double and Triple Digit Returns

“As we express our gratitude, we must never forget that the highest appreciation is not to utter words, but to live by them. ”
John F. Kennedy (1917-1963)
35th US President

Those are words we live by every day here at MarketClub and our parent company, INO.com. Our goal and mission is to help and assist our members get the very most out of MarketClub and all of the services we offer.

With thousands of members around the world in over 100 countries, we take our mission very seriously. Our goal is to provide you with the tools that will help you achieve the kind of results you may have only dreamed of.

It is with that in mind that I invite you to watch this four minute video on the World Cup Portfolio.

Since late 2007, we have been religiously tracking a portfolio that we designed to take advantage of the ever changing world we live in. This portfolio contains six core elements, all of which have performed extremely well in both Republican and Democratic administrations.

Continue reading "5 Years of Double and Triple Digit Returns"