

Last month, I published a post about the correlation of the World GDP and Copper prices. I also covered the close correlation of Crude Oil and Copper prices.
Chart 1 Crude Oil weekly: Sharp rebound
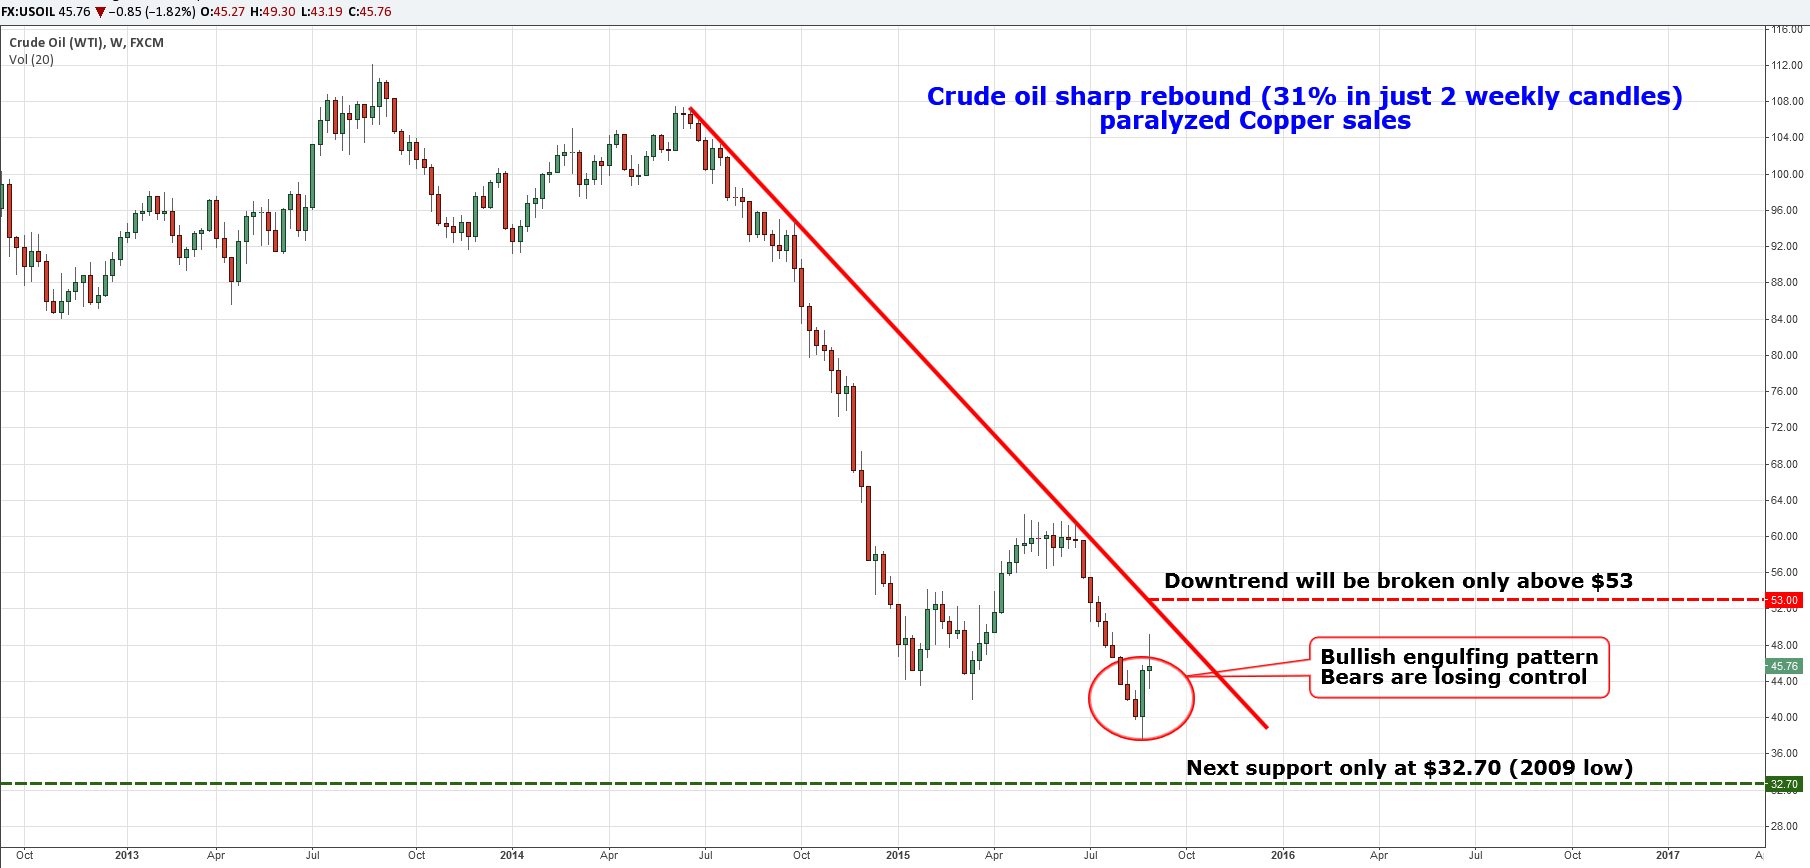
Chart courtesy of TradingView.com
As seen in the above weekly chart, Crude Oil bulls attacked the market without a declaration of war and caught sellers unaware. The price quickly grew more than $10 in just three days.
This severe price action on the weekly chart has formed a so-called Bullish Engulfing pattern. That's when the small red bearish candlestick is followed by a large green bullish candlestick that completely eclipses (engulfs) the previous week's candlestick. It means that bulls have taken control of the market and the price has gone lower (or is at the end of the decline).
Indeed, it can be just a correction and crude oil can continue its downtrend which will be only negated above $53, but it is quite a worrisome signal for Copper bears. This intermarket correlation analysis brings useful trading hints, especially for driven markets.
Chart 2 Copper monthly: August showed bears' exhaustion
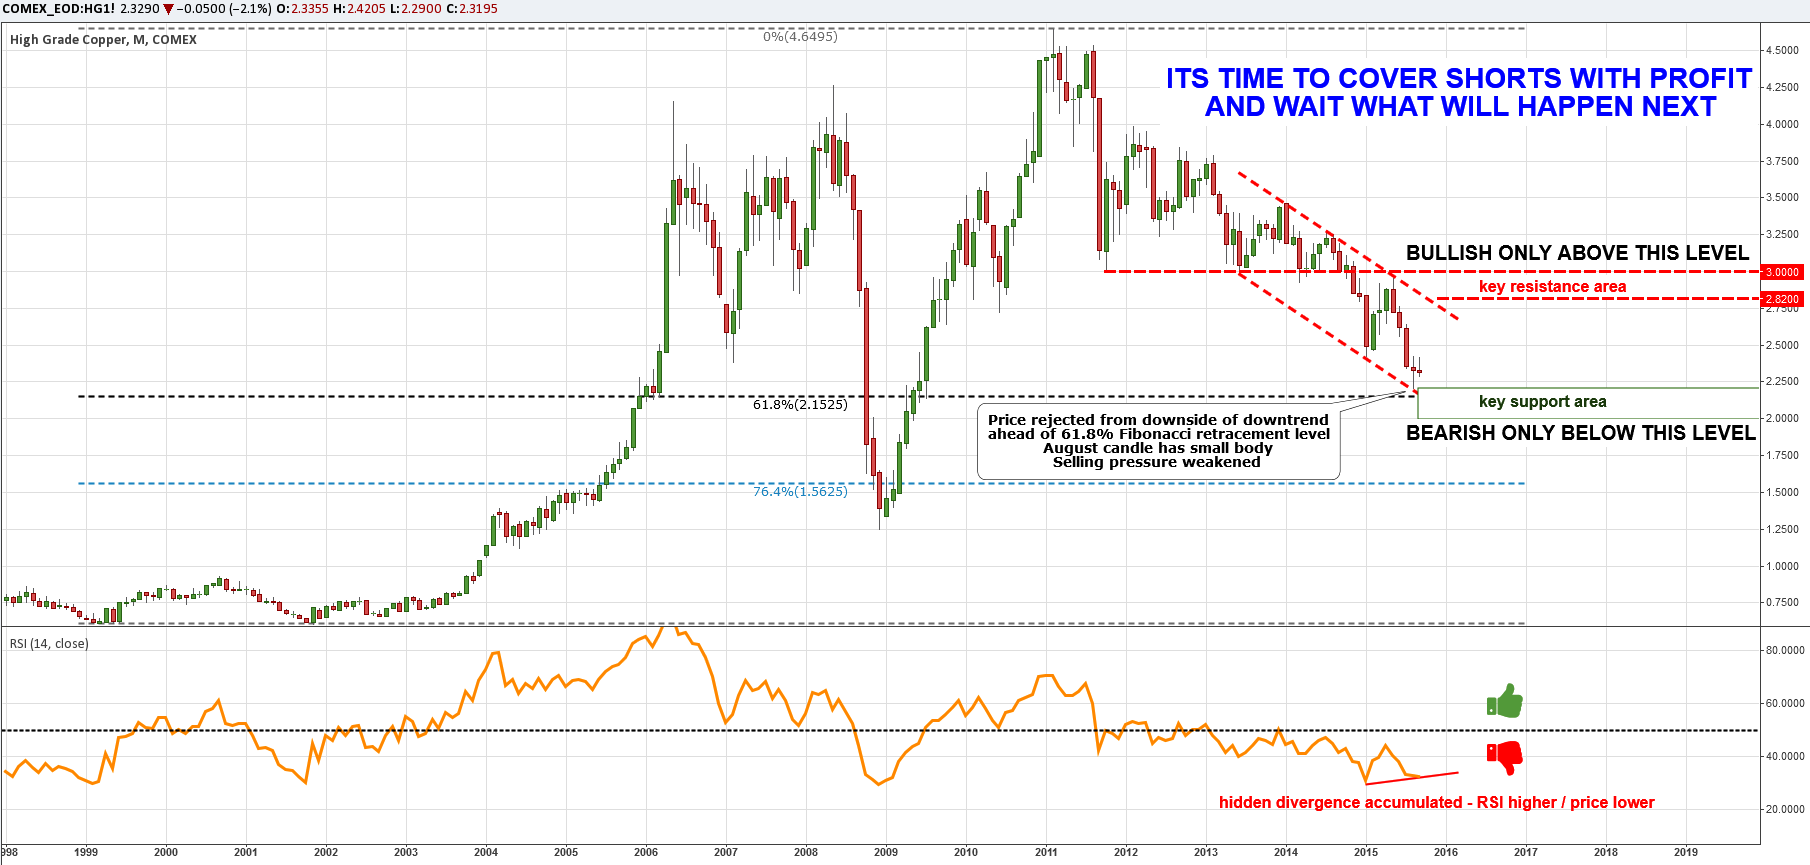
Chart courtesy of TradingView.com
Last month drew a small dojo-like red candle with a short two cent body. Another sign of the bears' exhaustion is the hard rejection of price from the downside of the downtrend ahead of the 61.8% Fibonacci retracement zone. And the last one is the accumulated hidden divergence on the RSI: the price has made a new low while the RSI has ascended higher.
I think two further possible scenarios could be in play: 1) Copper will sharply reverse up following the raging Crude Oil, or 2) it will get stuck here in a time-consuming consolidation. That is why I would cover those active shorts taken around the $2.8 (January $2.7545/May $2.8310) level, firstly to save and enjoy profits, and secondly to wait and see what will happen next in this restless market.
The current downtrend, like in other metals, is a part of a corrective move started in 2011 after hitting an all-time high at $4.65. Correction can be quite tricky as it can end up anywhere between the 38.2 and 61.8 Fibonacci levels or even deeper. This downside zigzag almost reached the 61.8 level which is the most common area of retracement and the chance of reversal is growing now.
The current overall game has been trapped within the $2-3 trading range. I would only think about entries above said margins. Aggressive players can try their luck in a long trade as the risk/reward ratio favors buyers. Stops should be set below the $2.15 (61.8 Fib-level) and watch crude oil closely for further clues.
Intelligent trades!
Aibek Burabayev
INO.com Contributor, Metals
Disclosure: This contributor has no positions in any stocks mentioned in this article. This article is the opinion of the contributor themselves. The above is a matter of opinion provided for general information purposes only and is not intended as investment advice. This contributor is not receiving compensation (other than from INO.com) for their opinion.
please provide us gold update.
so it's really help to take signal's against this market.
we will wait your reply.
please provide us gold update.
we buy gold 1136 to 1115,like 16XUA.so it's really help to take signal's against this market.
we will wait your reply.
Dear Manish, if you are already in position you should obey your trading rules.
If I would be long I should cover my position with stop below $1073 as I said it in my Gold update recently (https://www.ino.com/blog/2015/08/gold-update-major-reversal/ ).
indian news-
As per us fedral rate hike ot not,our govt.decide to cut rate's of interest.
2 day's before in india,our govt decide that if we have gold,we have morgatge(loan) and also dividend on gold prize.
diwali is still have 61 days,so festival sesion rock the gold.
to best-abiek
manish(india)
Thank you Manish, its really valuable information.
Consumer credit figure today was a huge increase. U.S. debt is still increasing, not deleveraging. Deflation will continue
to increase. Demand for oil, copper, and other commodities will trend ever lower long term as the massive world wide debt levels hurt growth and expansion for the U.S. and other nations. Expect the so called "correction" to become first, a recession, and then develop into the "D" word, a depression. Don't look for a near term recovery. Deleveraging will
take years.
Dear Dick, thank you for sharing.