

Copper advanced 15 cents or 7% higher from my previous post and it looks like we are going to see much more strength as it was just a warming-up.
Chart 1. Copper-Oil Weekly: The Metal Tries To Catch Up Consolidating Crude
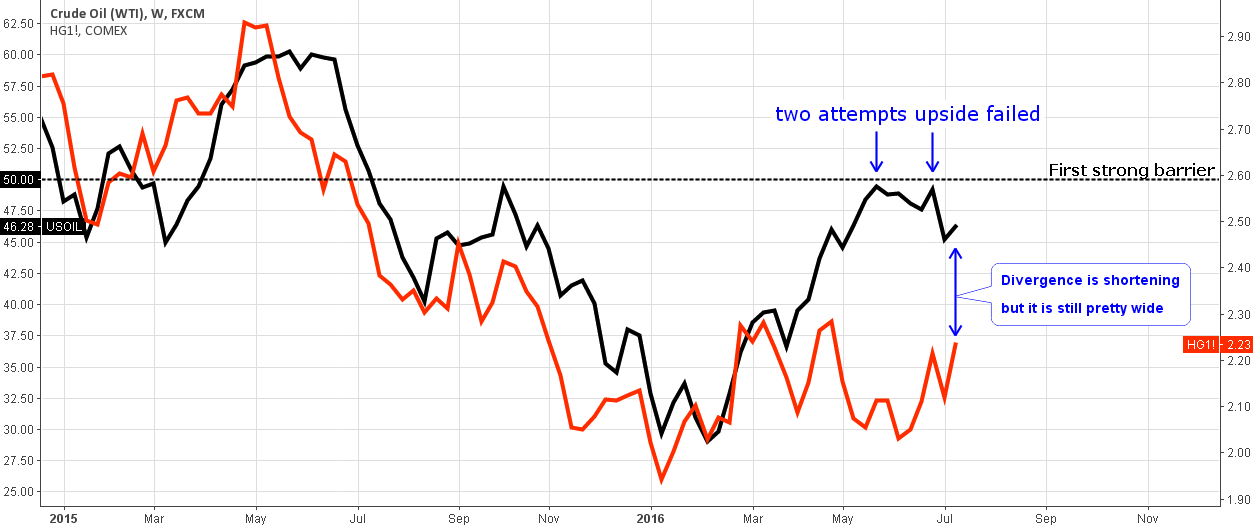
Chart courtesy of tradingview.com
The comparative chart above became a tradition. This time, there are no dramatic changes on it and the only drama here is the failure of crude oil to surpass the first strong barrier at the $50 mark (black dashed horizontal line). Oil has been stuck in a $5 range between $45 and $50 levels. We are at a crucial point as soon we will know for sure if it was a strong correction in oil before another huge drop to the $26 low or below or is it a consolidation before the break through $50 and then $60 barriers within a new uptrend.
Like the flower turns towards the sun the metal turns upside towards the strengthening crude. The divergence from the earlier post has shrunk albeit it’s still wide. The current oil price ($46) corresponds to the $2.5 level in copper and it gives hope to the bulls.
Chart 2. Copper Weekly: Inverse Head & Shoulders Pattern

Chart courtesy of tradingview.com
The target set according to the AB/CD concept in my previous post at $2.4375 hasn’t been reached yet, but the dynamics are positive (entry level at $2.0835).
The chart (2) above with weekly copper candlesticks supports both the correlation of chart (1) above calling for upside move and the previous post’s chart (2) with the AB/CD concept bullish setup.
The Inverse Head & Shoulders pattern has been detected (highlighted in orange). This pattern is quite regular in my posts. It is a reversal figure and it can give a signal for a major bottom in the market. You already know from my earlier posts how to measure the target. We should add the depth of the Head (distance from the Neckline down to the trough of the head, $0.435) to the break point ($2.213). The target is set at the $2.648 mark which is much higher than the previous post’s target.
The price has finished the week above the Neckline and it’s the first positive sign. The next week should open above the $2.213 and continue upside to confirm the pattern.
Chart 3. Freeport-McMoRan Inc. Weekly: Almost Double Price Target!

Chart courtesy of tradingview.com
One of our readers in a comment to the previous post asked about Freeport-McMoRan Inc. (NYSE:FCX) and its relation to the copper. Today I would like to share my view on this mining stock.
Below is the quote from the official website (www.fcx.com) of Freeport-McMoRan Inc.: “Freeport-McMoRan Inc. (NYSE:FCX) is a natural resources company with headquarters in Phoenix, Arizona. FCX operates large, long-lived, geographically diverse assets with significant proven and probable reserves of copper, gold, molybdenum, cobalt, oil and natural gas. FCX is the world’s largest publicly traded copper producer, the world’s largest producer of molybdenum, and a significant gold, oil and natural gas producer.”
The largest part of the revenues of the company come from copper sales and therefore the price of copper has the greatest impact on the stock price. It is confirmed on the chart above as we can see the same Inverse Head & Shoulders pattern (highlighted in orange) there. There is one obvious visual difference – FCX has a very beautiful symmetric shape of the pattern with a flat horizontal Neckline like in the textbooks. Another difference is that copper’s price has passed the Neckline already and FCX lags behind with its stock price below the breaking point. The possible reason for that is the consolidating price of gold and oil – the remaining components of the revenue structure.
The price should surpass the Neckline above the $14.06 mark and close above it to trigger the buy signal. The target calculation is described under the copper’s chart and set at the $24.66 mark. This is almost a double in price from the Friday close at the $13.11 level.
Intelligent trades!
Aibek Burabayev
INO.com Contributor, Metals
Disclosure: This contributor has no positions in any stocks mentioned in this article. This article is the opinion of the contributor themselves. The above is a matter of opinion provided for general information purposes only and is not intended as investment advice. This contributor is not receiving compensation (other than from INO.com) for their opinion.
I am in this trade for the technical reasons you stated, took a third position.
If it breaks above weekly pivot I will add to position.
You are spot on this analysis.
Thank you
FCX has been continually plagued by poor management and problems with the Grasberg mine in Indonesia.
Not worth the trouble.
I am glad that i saw the same IHS as you did and measure the same tagget.
Thank you very much for your analysis 🙂
Jean-Marie
Dear Jean-Marie,
Thank you for a warm feedback! 🙂
Aibek