

Sometimes we find a revelation in different things or places. Extending the range of our focus is quite helpful. From time to time I watch stock charts to find some interesting setups and to let my eyesight get a refreshing break from commodities and forex.
Last night I was browsing through some stock charts and my eyes caught a familiar structure on one of them. It was a chart of the iPath Bloomberg Coffee Subindex Total Return ETN (NYSE:JO). This instrument has a very interesting structure of complex correction on the chart. And today I would like to share with you an educational chart with a sample of a complex correction, which could take place in gold. It is better so see it once than to hear about it many times.
Chart 1. JO Monthly: Complex Correction
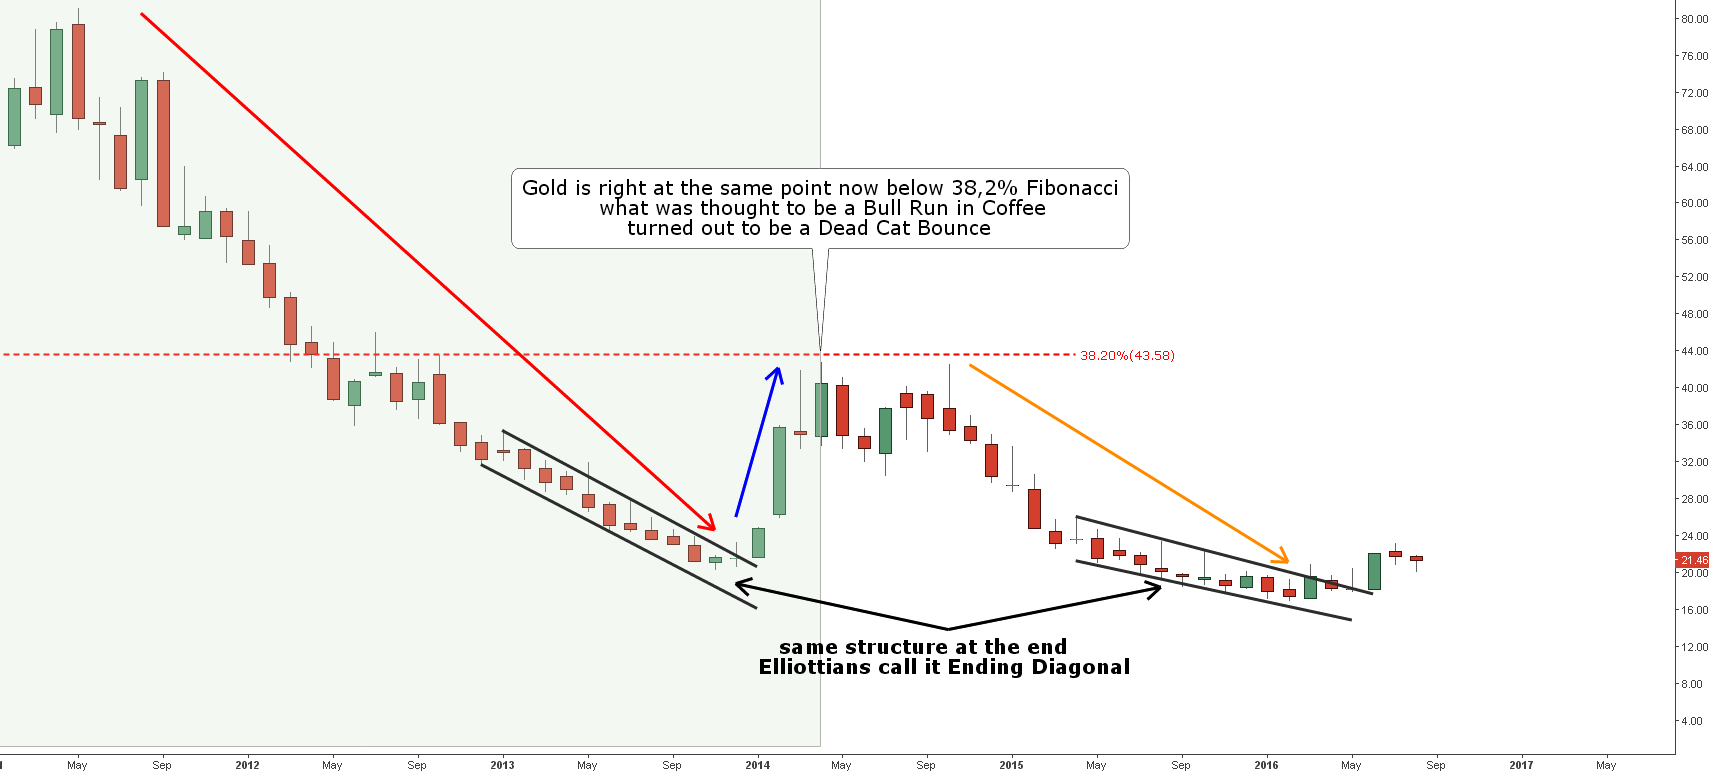
Chart courtesy of tradingview.com
Before you start examining the chart above please go to this link to see the gold chart to refresh it in your memory. Gold has the same structure of the drop like JO, but with the longer period highlighted by the red arrow. It took the coffee index a shorter time to fulfill the first leg of the correction – from 2011 till the end of 2013, gold bottomed only two years later last December.
JO broke out of the black mini-channel and moved sharply higher in a bullish manner in 2014 (blue arrow). It reached the maximum in April of 2014 at the $42.87 mark, just below the 38.2% Fibonacci retracement. Gold is right at the same position this month, I highlighted the area of the gold position on the chart of JO above in a light green color. We should be careful and watch the market closely as we can have the same scenario of a complex correction.
The coffee index didn’t drop at once; there was another attempt to the upside in October 2014 with the peak almost at the same level at $42.67. And another failure depressed the buyers as we can see the series of all red bearish candles after that (orange arrow). At the end of the drop, we can clearly identify the same black mini-channel as it was at the end of the red arrow, which is called the Ending Diagonal by Elliott Wave theory. Now the JO has broken out of it and moved higher.
You can see from the chart that the second leg (orange arrow) of the complex correction was not comfortable for long term players as it broke below the previous bottom crushing the hopes for the rise. And now you have seen it, and you are ready for such a turn in the market.
Although there is a chance of such a complex correction in gold, we should watch the gold market separately for its own signs of further price action. I shared with you this educational chart to show how the market can move not how it will move.
If you are interested in some technical patterns detected in the JO chart, you can stay and read further.
Chart 2. JO Weekly: Some Coffee?
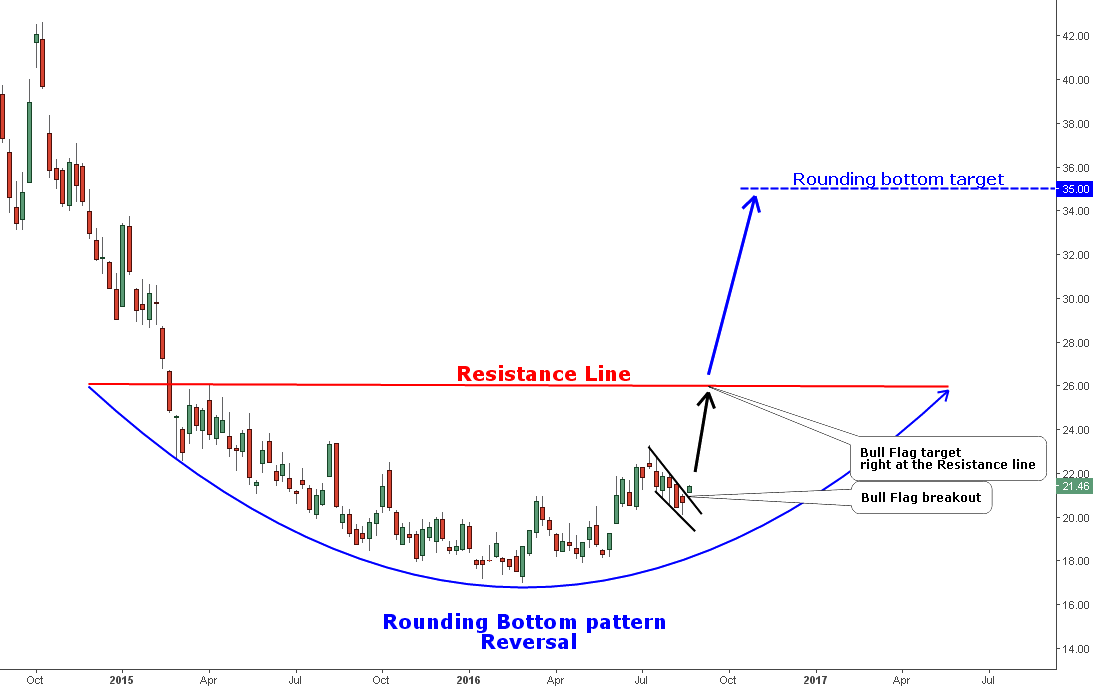
Chart courtesy of tradingview.com
We have at least two patterns detected on the chart. The short-term Bull Flag pattern highlighted in black has been broken this week. You are already familiar with this figure, and you should know that the target is a sum of the flagpole distance (the distance of the price growth before the pattern) and the breakout point, and it is located right at the red resistance line of another pattern at the $26 mark. It’s another $4.5 to go if you care.
The midterm Rounding Bottom reversal pattern is highlighted in blue on the chart. It should be confirmed by the breakup of the red Resistance line beyond the $26 level. We've already seen this pattern in my earlier posts; it has a variation called a Cup & Handle pattern. To find the target, we should add the distance from the bottom (April 2016) to the Resistance line to the level of the Resistance line. The outcome of this simple math is equal to $35 or another $13.5 to book as a profit.
Intelligent trades!
Aibek Burabayev
INO.com Contributor, Metals
Disclosure: This contributor has no positions in any stocks mentioned in this article. This article is the opinion of the contributor themselves. The above is a matter of opinion provided for general information purposes only and is not intended as investment advice. This contributor is not receiving compensation (other than from INO.com) for their opinion.