
Silver surprised us with a strong Santa Claus Rally. It woke up like an ancient volcano and with a booming eruption. Before that, we proclaimed silver to be dormant compared to a vigorous rival, gold.
Everything changed at the end of 2018 as gold gained 10% from the lows and a weak silver tried to catch up to make the same profit at the very end. Bargain hunters couldn’t pass by this clear market distortion and took their chance to book a nice profit of around 4%.
In my earlier post I updated the medium term gold chart for you. Last time I updated the big chart of silver in October, which was titled dramatically “Fly Or Die” as submissive behavior of silver was leaving less and less hope for investors.
This time I am going to update the silver chart, but using a different approach. You are already familiar with it as I used historical clones with gold and silver before. The latter one was successful. This time it will be extended as I will use two clones instead of one from different historical periods so you can choose.
Let’s start with the distant one.
Chart 1. Silver Futures Monthly: Echo Of the 80s
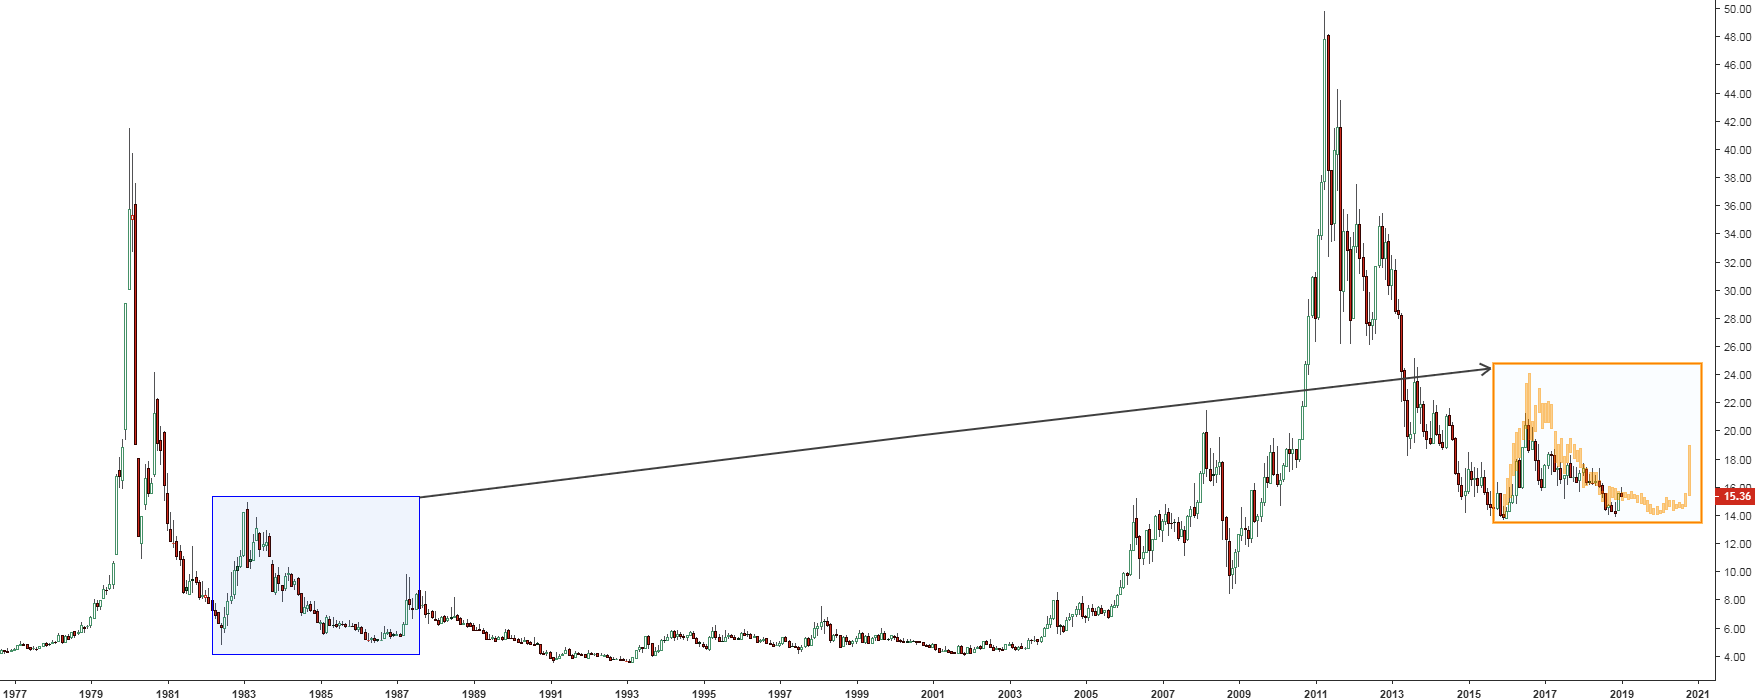
Chart courtesy of tradingview.com
This chart was built in a high resolution, and I recommend you to click on it to open in a new window to see a larger image in details, especially in the right clone (orange box).
It shows that history could repeat after almost forty years. In the late 70s and the early 80s, we got the same rocket move of the silver futures price, which had exhausted at the beginning of the $40 area: the same movement we had in the late 00s and early 10s of this century.
I copied the bar pattern in the left blue box and added it in the area of the right orange box as they are located at the same stage of this enormous downside correction. So far the trajectory of the move in the orange box coincides with the orange bar pattern. The candles of the current move do not copy the sequence of the added bars perfectly, but the timing of the peaks and troughs and even inner consolidations do match so far.
The next move is expected to be the extended sideways consolidation followed by revisiting of the former valley around the $14 level. After that, we could see a relatively small move up, which will be retraced quite deeply and then the final shot to the upside in the area of $19 could emerge till November of 2020. This pattern requires a lot of patience, and limited expectations of strong gains as the market couldn’t retest the earlier top (corresponding to $24 nowadays) in the 80s. Let’s see what the recent case could show us below.
Chart 2. Silver Futures Weekly: Recent Model
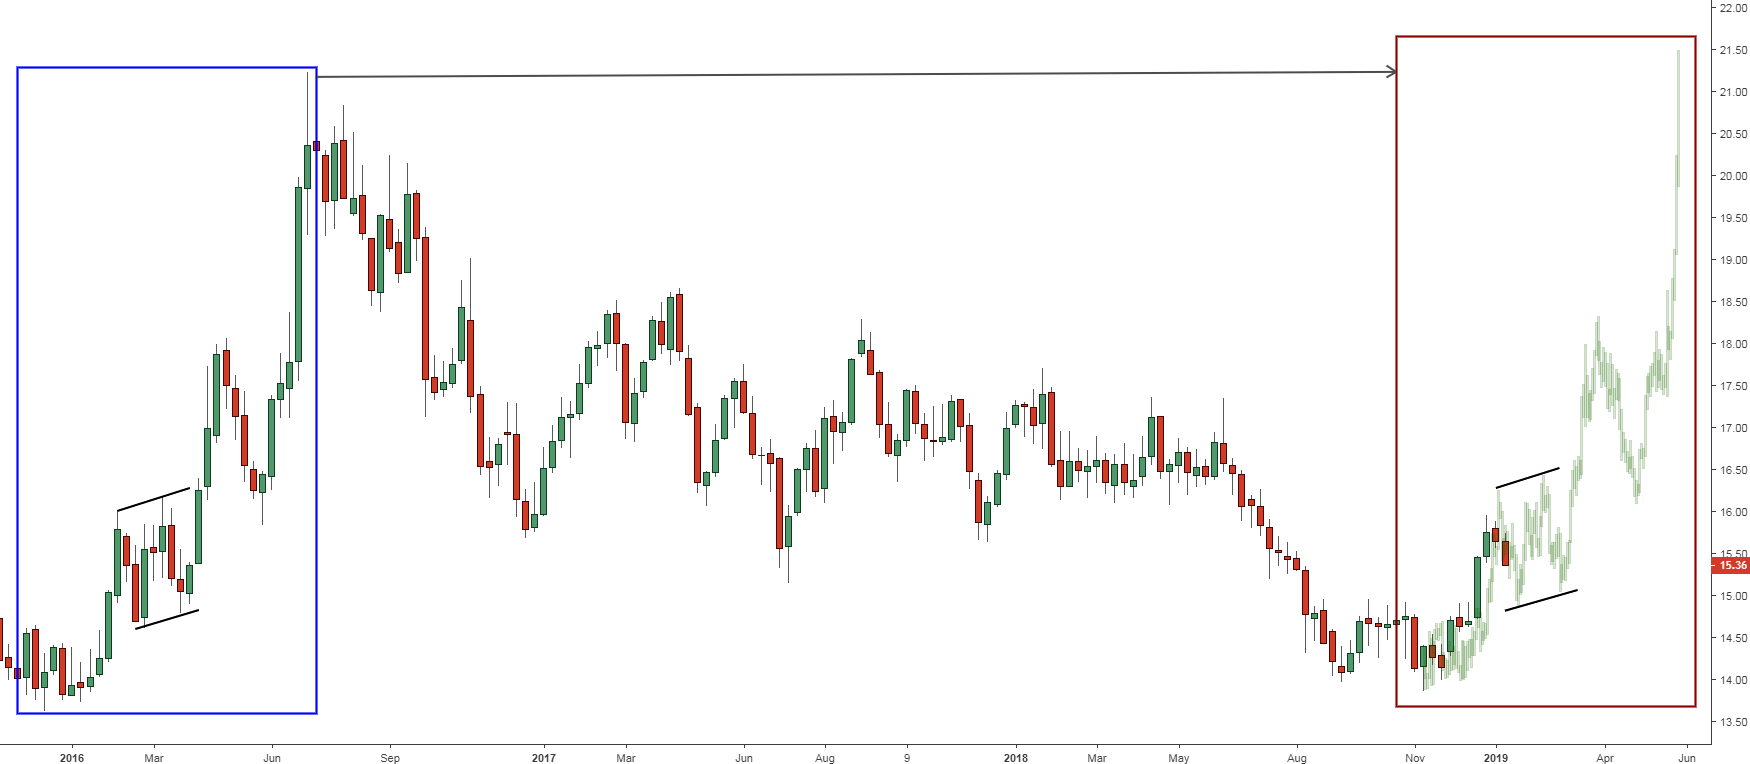
Chart courtesy of tradingview.com
This chart was built in a high resolution, and I recommend you to click on it to open in a new window to see a larger image in details, especially in the right clone (maroon box).
This idea is not new, and you are already familiar with this map as I drew it for you before, but without using a cloning approach. The latter is a fine tuning of a general chart to augment it with market stages and price action.
The move up, which started in December of 2015 and emerged in the first half of 2016, is highlighted with a blue box on the left. I copied it in the maroon box on the right with the green bar pattern. Again, as we saw it in the first chart of the 80s above, we also have a reasonable reconstruction of the trajectory and even amplitude of the moves, although the recent peak ($15.96) couldn’t reach the projected point of $16.3.
The current weakness began slightly ahead of time, and the market could get stuck here for some time within a sideways consolidation, which was contoured with black parallel trendlines in both boxes. The price in the pattern dips below $15 in the area of $14.70-14.90. After that it makes another zigzag up and down between $16.50 and $15, only then it finally goes up. So, watch this stage closely as after it finishes, there could be an excellent buying opportunity. The price levels should be adapted as we already have a lower peak and hence the dip could be lower. The structure of the chart does matter not the exact levels.
The ultimate target is located above $21 level and is thought to tag the earlier top at least. Let’s see how the market would emerge as we never know the future, but we can try to read the clues on the chart.
Intelligent trades!
Aibek Burabayev
INO.com Contributor, Metals
Disclosure: This contributor has no positions in any stocks mentioned in this article. This article is the opinion of the contributor themselves. The above is a matter of opinion provided for general information purposes only and is not intended as investment advice. This contributor is not receiving compensation (other than from INO.com) for their opinion.
I'm looking at the BIG picture - we already know from the 80's we went into a boom in the 90s - the internet boom. Thanks to recent events, we may see a manufacturing boom and a technology boom in other areas in the next few years. That would put us in a similar economical phase with I expect similar results. - Alternatively a strong move to the left and a possible conversion to communism which seems to be getting popular and the ensuing unprecedented tax rates would decimate the dollar and silver would attain some of those highs the clowns usually talk about in the silver commercials.
Metals markets in general are very highly manipulated. The same silver is sold A 100 TIMES OVER, on future contracts, stored physical silver (which in reality does not even exist) means that the market makers do not want price increases which would increase their total liability. THE TREND-LINE IS DOWN, not up as the chart would have you imagine. The spiraling national debt will not help silver, if it did silver would be $40 an ounce today. The stock market is a bully on steroids; it has it's foot clamped down on the metals market and it will not let up anytime soon. I bought silver over 7 years ago and it worth 10% less than I paid for it; it is out-off-favor. Nothing here convinces me otherwise.
Based on technical study, I found that for Silver,(Last Closing 15.7485) now on wards, $ 17.77, $18.85 , $21.45 and finally $23.65 are major resistance levels, and any strong Bull-Run can be expected only after crossing such hurdles.
As per mid or long term view, I think, final bottom formation still remains pending, so do not be surprised, if found any down trend again.
Considering currant overall situation of Entire Financial Sector, I think, it is meaningless to think, possibilities like either about echo of 80s or about recent model because compare to 80s markets, drastic changes taken place in financial sector, all markets become far more volatile and uncertain, moreover, markets are govern on multiple and constantly changing equations, complex trading patterns are working on strange basis, so it is quite difficult to obtain any pre-determined perfect market movement-um.
Until found any reliable trend signal with consistency, one should play just short term swings.
in my next post, i will try to provide some technical levels accordingly.
The charts do not take into account the massive increase in the U.S. national debt (it was in the billions when gold hit $40 in 1980, and is now $22 trillion and counting).
Sorry, meant silver hit $40 in 1980
The future price of silver will be very different compared to the 80ties. For several reasons but the most important one is that silver will be on the blockchain in 2019. This will imply that the impact of manipulation, as is today, will be less and less in the future. In the Netherlands there are ‘devs’ working very hard on this solution via 'tokanisation'. So we can expect huge news this year!! Which automatically will mean a lot higher ('normal' and 'free market') silver prices...
Dump is going to bring on another Republican1929 and very possibly WW-lll now that the GOP has brought such success to China (Thanks Nixon) and Russia (Thanks Cheney/bush) and, in turn their militaries. And with these disasterous events the Precious Metals are going to the moon. Sadly, what kind of a world will be left after the Carpet Baggers to the Ultra Wealthy have blown it up!.... 🙁