
Back in February, I wondered: “How Far Could Crude Oil Go?” As this commodity confirmed the upside reversal breaking above $54.6. We are still living in a “PetroWorld” therefore the price of oil is crucial, and it impacts all of us around the globe. So, we should watch it carefully.
I spotted a structural similarity on the weekly chart, which was cloned and applied to the current pullback of oil price on the lower time frame daily chart. The price target was set at the $63.7 and the time goal was set on the 6th of May, 2019.
Before we move on to the updated daily chart, I would like to show you the results of your ballot on this topic.
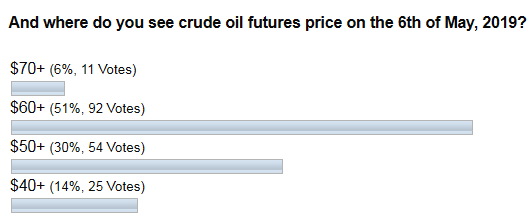
I can’t express all my gratitude for your voting activity and support of my experiments. The results in the diagram above show that you also saw the area above $60 as a target for the current pullback. It is yet early to say if the price has topped already, but our initial target was achieved and even was passed over ahead of time.
In another ballot, you voted for the instruments you liked the most.

Here again, most of you supported me by choosing “All” instruments option. Thank you, my friends! The second runner was a classic Fibonacci retracement level and its quite natural answer as pullback means retracement.
Ok, let’s get down to the updated daily chart and see how price moved compared back to back with the clone.
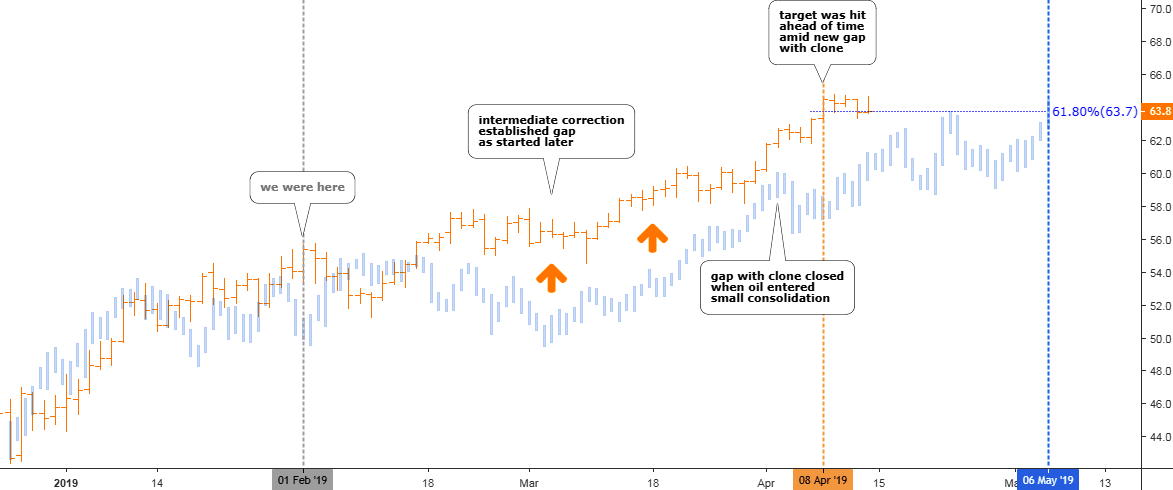
Chart courtesy of tradingview.com
The clone target of $63.7 was hit one month earlier than predicted on the 8th of April, 2019 (orange vertical line). The highest point of the current pullback was established more than $1 higher at the $64.8 the next day. Last Friday the price drifted lower to close right in the area of the initial target.
Only the first leg of the clone (blue bars) till the mid of February looks similar, and then the actual price dynamics (orange bars) has made a spin-off to move higher. An intermediate correction of actual oil price has started later and was shorter than that, we can observe in the clone. The gap between the clone and the actual price trend continued till the beginning of this month as crude oil has made a pause in a minor consolidation and clone has accelerated its move up to catch up with the real price. Right after that, the acceleration has exhausted and the actual price of oil moved further up after the short break to make a new gap with a clone. That brought us an early victory. The oil price has gained more than 16% since the previous post was written. My congratulations to all of us!
The target has been reached and what is next? Let’s see the updated weekly chart, which was the model for the clone to find out if there is any clue.
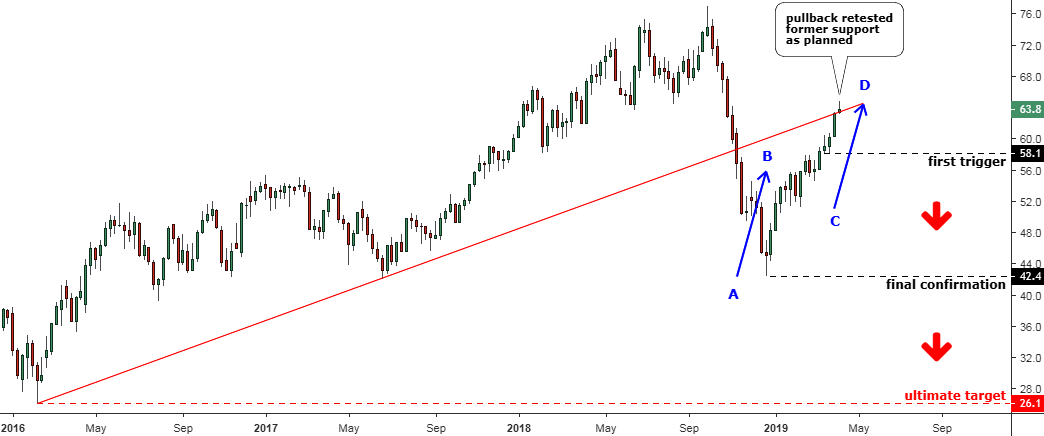
Chart courtesy of tradingview.com
It is early yet to judge if this upside move has been topped or not, but the current pullback accomplished the minimum target as it finally retested the former support (red trendline). And so did the blue CD segment, which is equal to the blue AB segment. It means that the second leg of the pullback also reached the minimum target. Add here that the price retraced the standard 61.8% Fibonacci level and the picture starts to become worrisome for the bulls.
As we are not guessing the tops let’s see where we can set the triggers once the price starts to collapse. The first one is located at the $58.1 level where the earlier minor consolidation has bottomed. The concept is that the price should not break the preceding consolidation, but should continue in the direction of the main trend building the move up after each consolidation. When it breaks the latter one, then we should see if there will be a consolidation after a down move to confirm the reversal.
The final confirmation is located at the bottom of the current move up at $42.4. The thing is that we already saw the complex corrections and the current move up could just be the first leg of more complicated pullback. The price could retest the current top one more time but should tag the former bottom of $42.40 first.
Ultimately the drop should retest the former bottom of $26.1 to complete the structure.
Please leave your comments below sharing your thoughts about the oil price future.
Intelligent trades!
Aibek Burabayev
INO.com Contributor, Metals
Disclosure: This contributor has no positions in any stocks mentioned in this article. This article is the opinion of the contributor themselves. The above is a matter of opinion provided for general information purposes only and is not intended as investment advice. This contributor is not receiving compensation (other than from INO.com) for their opinion.
Do you any dedicated shortcut or icon on Ur web to point out any IPO News? Please inform.
Aibek,
I have been interested in knowing more about the basics of a stock chart, such as the one shown in your post. Last year I purchased one stock of an oil company that I could afford and I also purchased an IT stock, also what I could from the money I transferred from a bank into a TD Ameritrade account. It wasn't more than $50, but I wanted to start investing very little in hopes of the stocks increasing in price and also in hopes of dividends or splits. I kept reading that with the Trump administration was helping the stock market before the year was out, I wanted to get on the band wagon with what I had to invest.
Recently, I thought of learning more about stocks and trades that I could make a living at it. That maybe find a resource that would help me in learning the basics that I could trade with great results or even to understand what to look for in a stock I am interested in. I know it is all patience and instinct, not to mention luck on investing on the stock market. It has been all instinct right now and learning on my own what I should be looking for by reading articles in books and online. With help of other well educated people with the market, I would hope to be better at it.
With not having a full time job for over 15 years, I have lost out on having any IRA or extra money to use on investing. So, when I do have extra money to use, I invest on what I can afford just to have a nest egg. I just want to know the basics from one person or resource instead of getting into to many resources that don't explain it very well me to follow. Most of the time the resource goes into much detail that my attention drifts. Just one easy to read steps on what needs to be covered more for a beginner investor like me, would be helpful. Would you be able to point me in the right direction of the resource that would help me for a simple easy follow instructions just for the basics?
Dear Diane,
First of all, you should clearly distinct investing from trading.
For some people investing means that you like the company’s product and you would like to participate in its success. It’s like falling in love, but with the company.
Some people, like in a real life, don’t look for romance, but bet on the leaders/winners to have a stable and predictable future. They study company’s financial situation first and if they are OK with it, then they buy the stock.
Trading is a speculative activity. Traders try to predict the direction of the next move in the market and act accordingly, usually its a short-term game. Most of the traders are gamblers as this sphere is full of hype and ego, which attracts people. Gambling is a trading without a plan and strategy, i.e. chaotic pushing buttons, usually winning trades are closed quickly and one single losing trade breaks account.
As I wrote here in the blog, 9 of 10 traders lose money. Trading is not easy. It’s a job and market is the boss, not you. Full-time trader should fight his instinctive reactions, psychological traps and often...loneliness.
Before you invest money, you should invest your precious time into studying. You should start from the very beginning.
I did it the hard way as 21 years ago at my place there were few people knowing the stuff. When I started as a junior gold trader, I asked our Singapore partners to teach me some basics of trading and setting the stop loss was the first and the best lesson aside from the time zone change related patterns.
Before that I studied from books the most popular indicators like RSI and MACD. And one by one I go through trends, candlesticks and all other basic stuff.
These days you have an advantage of structured and easy-to-use information. Investopedia and babypips.com are a few of them. And this would be only the very beginning, as after that you will just start to understand the slang of the “street”.
To earn money you should find the strategy that works. This is the hardest task - but there is no free lunch. Here are two options - to find the successful mentor/coach who could share his method or follow the advices of such people that you can find on the web.
Before you start better go demo/paper/simulation just to test the strategy (it should be the list of rules). After successful trial you can switch to small real account...first of all to test yourself, your emotions/reactions, find your own boundaries and triggers. Then adjust your strategy according to your psychologic profile. Only then you can start if you were not scared on your way.
One of my good friends, he is a veteran of the market, invested all his money in the ETF, which tracks the S&P 500 index as he read one book. which tells that its hard to beat the index in the long run. It’s interesting that he bought the big portion of it on the top of 2007 before the crisis and slept well through the huge drop, which followed later and the S&P500 has almost doubled in 12 years since then. He added every time he was paid some bonuses or accumulated savings.
So, there is a variety of options. Best of luck, Aibek