
Silver futures continue to maintain leadership not only among metals, but compared to all futures as we can see in the leaderboard below.
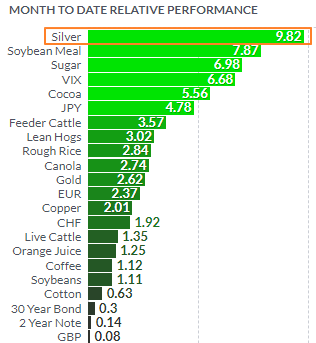
The white metal has seen gains of close to ten percent month-to-date. None of the metals come close as copper futures, formerly the number two, has lost its shine lately as I shared the reason last week. When compared to silver futures, gold futures appear pale with gains of 2.62%.
All last week, I observed a pattern in the making, watching to see when it would trigger. As a result, exactly at the end of last week, the expected event happened. Here is a visual representation in the daily chart below.
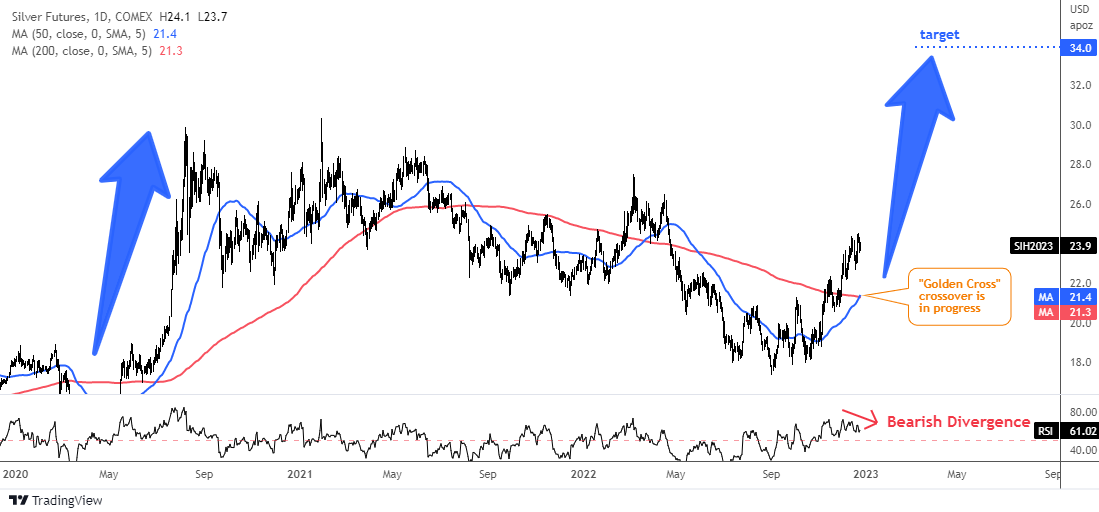
There are two simple moving averages in the silver daily chart above. The blue line represents a 50-day moving average and the red one is a 200-day moving average. We can see that last week the short-term blue line crossed above the long-term red line. This pattern is called a “Golden Cross”. It is a bullish sign as it indicates a change in the trend to the upside.
The silver market seems to be waking up from its long hibernation within a large consolidation, which was also indicated by flat moving averages and a deep crossover to the downside during the last leg down.
Let’s get down to measurements to find out how high the silver futures could skyrocket on this bullish confirmation pattern. History could be helpful for us. The last time this crossover pattern occurred was in the summer of 2020. The following rally, both in price and in the blue moving average, took silver futures price to almost $30 for almost $13 from the crossover price of $17.
The current Golden Cross appears at the price close to $21. The target is located $13 above at $34. It is over $10 or 42% potential gain for silver investors.
There is another alert we can see on the chart. Since the beginning of the month, the RSI indicator has not followed the price because it shows lower peaks that contradict the higher highs on the price chart. Such a pattern is called a Bearish Divergence and the outcome won’t please silver bugs.
Since the market needs a break to build up energy for the expected rally, it should consolidate. The price could retest one of its moving averages before resuming bullish growth.
The “Golden Pattern” for gold is on hold and here is why.
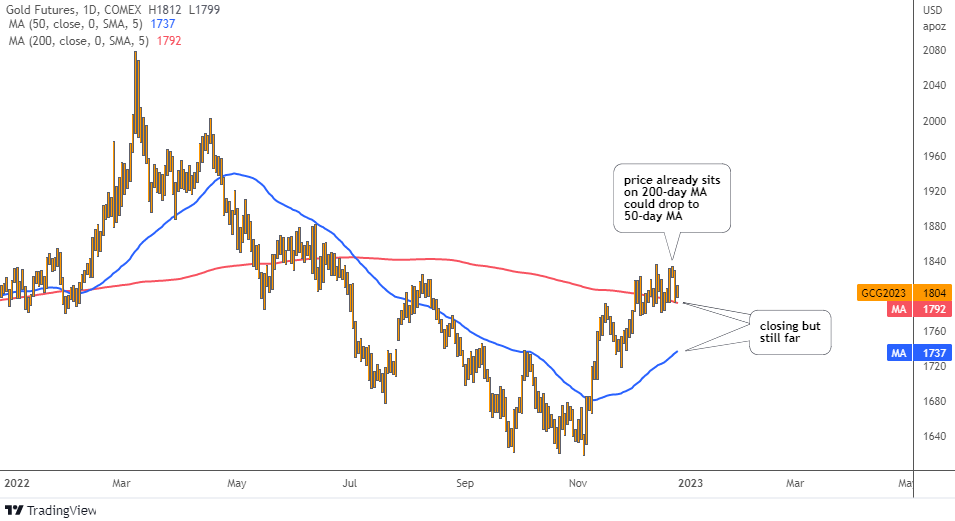
The blue line of the 50-day simple moving average is approaching the red 200-day simple moving average, however, it is still far from making such a coveted crossover to the upside.
The gold futures price sits on the 200-day moving average, while silver futures are much higher. This could result in sinking down to the blue 50-day moving average around $1,737 during anticipated consolidation as the RSI shows a Bearish Divergence here as well.
Intelligent trades!
Aibek Burabayev
INO.com Contributor
Disclosure: This contributor has no positions in any stocks mentioned in this article. This article is the opinion of the contributor themselves. The above is a matter of opinion provided for general information purposes only and is not intended as investment advice. This contributor is not receiving compensation (other than from INO.com) for their opinion.