Is The Dollar Headed Into The Abyss?

Back in January, I attempted to answer the question “Is Dollar's Dominance Over?”, as the dollar index (DX) had experienced significant losses.

However, we received two conflicting signals from the technical chart, which provided a bearish alert, and the interest rate differentials chart, which indicated support for the dollar.

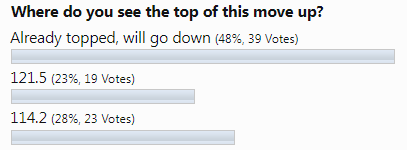
In both polls, the majority of readers voted that the dollar's dominance was over and that it had already peaked for the dollar index.

Since then, the DX has made a bounce close to $106 with the support of a hawkish Fed, however these gains proved to be unsustainable, and the price dropped back down to hit the valley established in January, reaching a new low of $100.

Is the dollar headed right into the abyss?

Let's take a look at some updated charts, starting with the interest rate differentials.

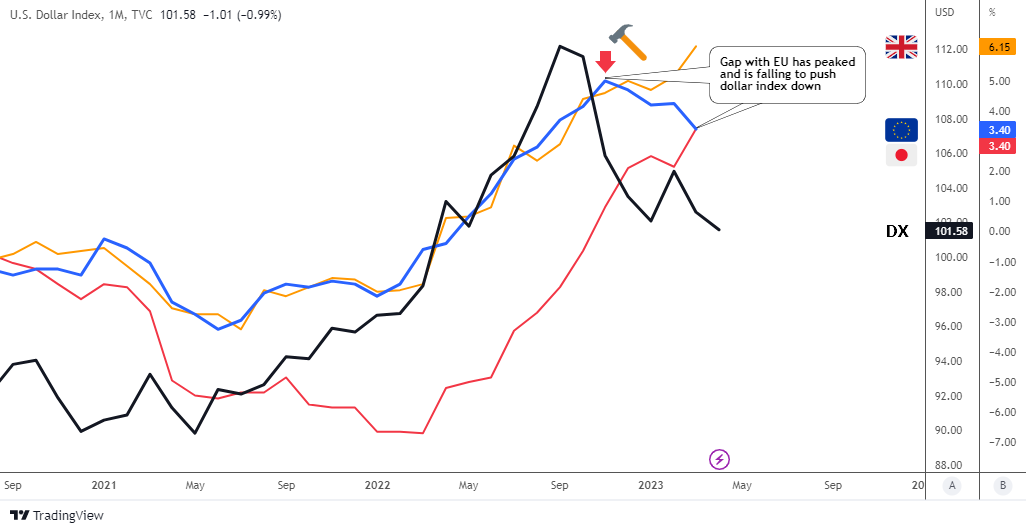
DX vs Real Interest Rates

Source: TradingView

This time, I will be using a monthly time frame to provide a closer look at what could potentially cause the dollar to decline. Continue reading "Is The Dollar Headed Into The Abyss?"

Bitcoin VS Gold VS S&P 500

How does gold and its digital competitor Bitcoin relate to each other?

Gold is a traditional store of value, while Bitcoin from a conventional standpoint is highly risky. Even though the latter was nicknamed "digital gold," we can see from the chart below that it does not act like one.

Which opinion do you support?

View Results

Loading ... Loading ...

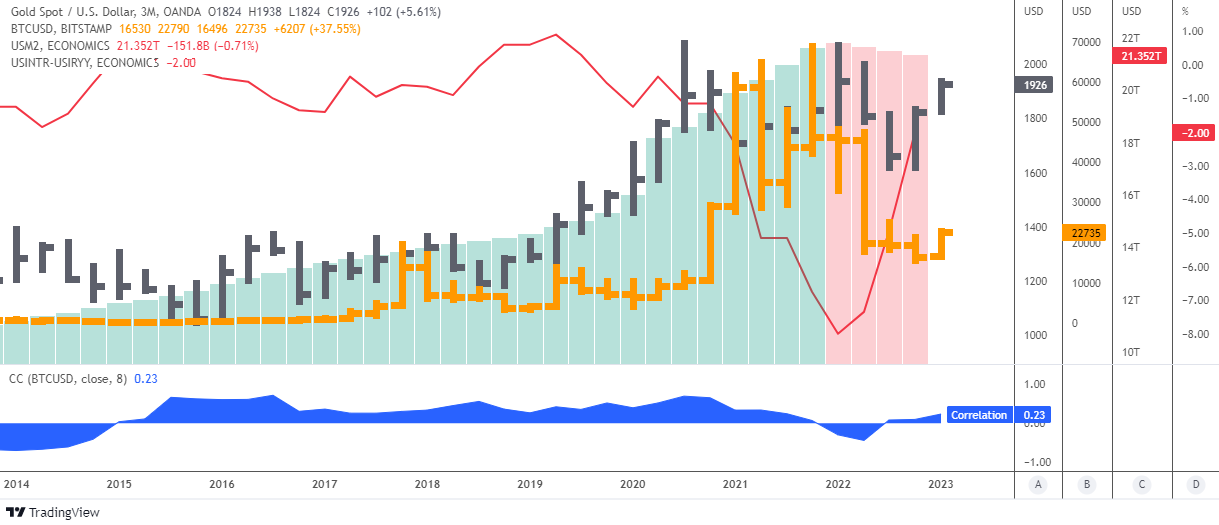
Gold BTC USM2 Real IR Quarterly

Source: TradingView

In the above quarterly chart, I combined 5 items:

The gold price is in black bars on scale A. The Bitcoin price is in orange bars on scale B. The U.S. money supply indicator M2 (M2) is in histogram on scale C. The red line represents the U.S. real interest rate (RIR) on scale D. There is a 2-year correlation coefficient of Bitcoin to gold (blue) in the sub-chart. Continue reading "Bitcoin VS Gold VS S&P 500"

Is Dollar's Dominance Over?

Last September, the Congressional Research Service published an "In Focus" report. They had already attempted to address speculation about the dollar's dominance in the face of global economic and geopolitical changes at the time.

Three major threats were addressed in that document.

China and its currency have risen to sixth place, accounting for 1.66% of global payments.

The next source of concern was US financial sanctions, as the share of Russian exports to Brazil, China, India, and South Africa in US dollars fell from 85% in Q2 2018 to 36% in Q4 2021.

Digital currencies, which include cryptocurrencies and digital currencies issued by central banks, have completed the list.

“Some policymakers have expressed concerns about an international race to create a digital currency with widespread adoption, arguing that the United States should create a U.S. digital currency to maintain the dollar’s prominence in international payments.”

"To date, there is no evidence of a shift away from the US dollar as the dominant reserve currency," the study concluded.

Back in October, I shared my most recent update for the dollar index, as it hit the first target with a fresh outlook.

At the time, I proposed two paths for the dollar: a continuation to the next target of $121 on an aggressively hawkish Fed, or a consolidation before resuming to the upside. The majority of readers supported both paths, with the consolidation option coming out on top.

The question of the dollar's dominance is resurfacing these days, as its value has plummeted dramatically. It is too early to tell whether this is a consolidation or a global reversal.

One thing is certain: the path of unending growth has been abandoned.

In my charts, I see a clash of perspectives. The technical chart is about to give a strong bearish signal. The chart comparing fundamental factors, on the other hand, supports the king currency's continued strength.

Let me show you each of them one by one, beginning with the emerging bearish alert. Continue reading "Is Dollar's Dominance Over?"

USDJPY: Reversal or Setback?

Back in September, I shared with you my take on the USDJPY currency pair based on 360° view. A combination of fundamental factors and technical factors has supported the continued strength of the U.S. dollar relative to the Japanese yen.

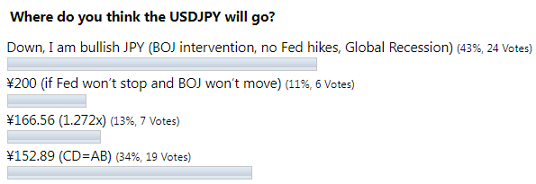
However, the majority of readers predicted the opposite, as you can see in the screenshot below.

Poll Results

As the second largest vote played out the best, the USDJPY has soared more than six percent to reach a peak of ¥151.94. The previous time this level appeared on this chart was in the summer of distant 1990, two decades ago. That move was close to hit the CD=AB target at ¥152.89, however it has lost the momentum.

The pair has lost more than it gained in that call and there is a question, is that all or are we just in a large correction?

I prepared for you another bunch of visualizations below to answer that question.

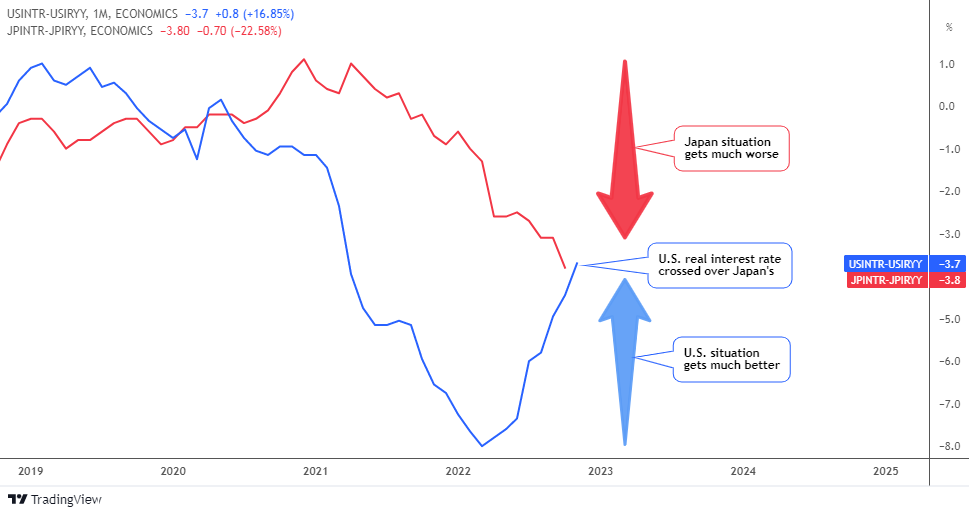
Let’s start with the fundamentals first in the interest rate comparison below.

US vs JP Real Interest Rate

Source: TradingView

Continue reading "USDJPY: Reversal or Setback?"

The Dollar Has Hit The First Target

The king currency has finally hit the first long-term target of $114 that was set in the summer of a distant 2019 when it traded around $96.

That aim wasn’t clear then as the dollar index (DX) looked weak in the chart. The short-term structure was similar to a pullback after a heavy drop.

The majority of readers did not believe the DX would ever raise its head as you can see in the 2019 ballot results below.

Ballot Votes

However, I had found a bullish hint in a very big map, and I warned you “Don't Get Trapped By Recent Dollar Weakness”.

Back in August, you had already been more bullish on the dollar as you voted the most for the target of $121.3 in the earlier post. This confidence is due to the certain position of the Fed, which resolutely fights the inflation, lifting the rate aggressively round by round.

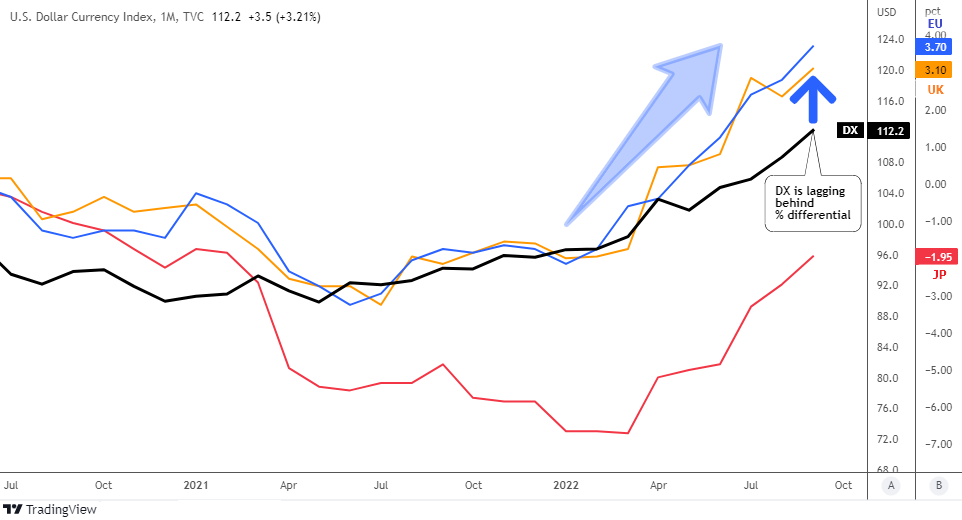
Let me update the visualization of the real interest rate comparison below to see if the dollar still has fuel to keep unstoppable.

DX Monthly vs Real IR

Source: TradingView

The real interest rate differentials are shown on the scale B: blue line for U.S. - Eurozone, orange line for U.S. – U.K. and the red line for U.S. – Japan. Continue reading "The Dollar Has Hit The First Target"