March Was A Month Of Ups And Downs

Hello traders everywhere. March was a month of weekly ups and downs with two weeks to the positive and two weeks to the negative, but at the end of the month, the stock market will end in positive territory with the exception of the DOW. In fact, it will close out a strong first quarter to start the year.

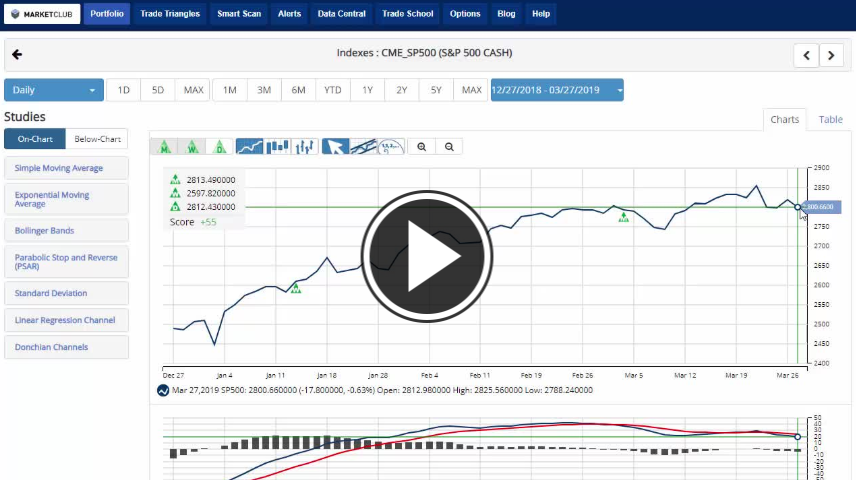
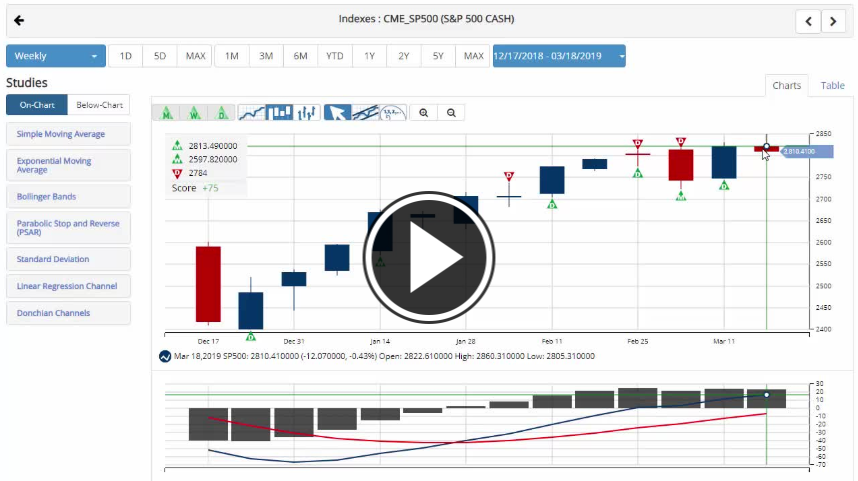
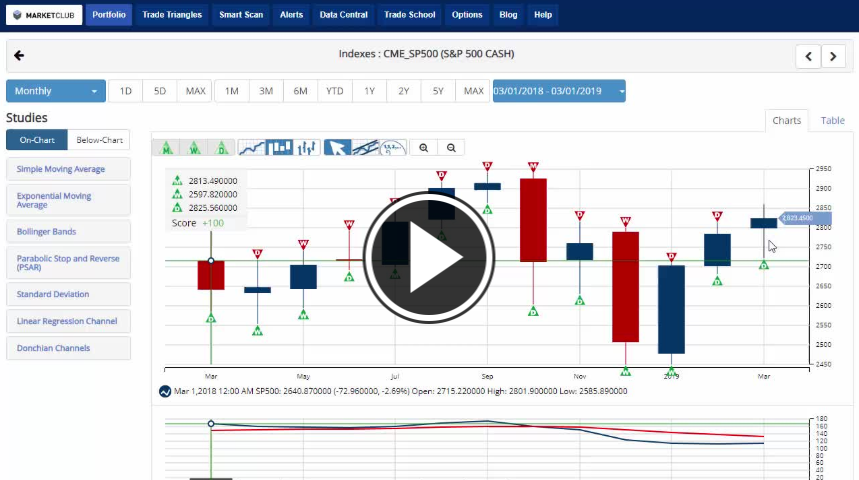
Both the NASDAQ and S&P 500 will post monthly gains for +2.4% and +1.54% respectively, meanwhile, the Dow will post a monthly loss of -.3%. On a quarterly level, all the indexes will post gains for the first quarter of 2019. The S&P 500 checks in with a gain of +12%, the Dow +10%, and the NASDAQ will post the biggest quarterly gain of +16%. Quite a start to the year.

quarterly gain

After starting off the year slowly losing -.49% in January the U.S. dollar bounced back with consecutive monthly wins gaining +.90% in March. The two winning months pushed the dollar to +1.1% gains for the first quarter of 2019. Continue reading "March Was A Month Of Ups And Downs"

Falling Treasury Yield Pressures Market

Hello traders everywhere. The benchmark 10-year rate traded at 2.36% and hit its lowest level since late 2017. Investors are keeping an eye on rates after the 10-year fell below the 3-month rate last week for the first time since 2007. It is a development that investors call an inverted yield curve and is seen as an early indicator of a recession.

The U.S. Treasury yield curve has inverted before each recession in the past 50 years and has only offered a false signal just once in that time, according to data from Reuters.

10-year rate

Yields fell on Wednesday after Stephen Moore, who is expected to be nominated to the Federal Reserve Board of Governors, called for the central bank to cut rates by half a percentage point. Moore made his remarks in an interview with The New York Times, noting he is not a "dove" or a "sycophant" for President Donald Trump.

Key Levels To Watch This Week:

Continue reading "Falling Treasury Yield Pressures Market"

Yield Curves, 2-Year Yield, SPX (and a crack up boom?)

While the 30-5 year yield curve does this, implying some inflationary issues…

30yr yield minus 5yr yield

The more commonly watched 10-2 year does this, implying ongoing Goldilocks…

yield curve

While the nominal 2-year yield does this, implying “ruh roh!”Continue reading "Yield Curves, 2-Year Yield, SPX (and a crack up boom?)"

Weekly Futures Recap With Mike Seery

We've asked Michael Seery of SEERYFUTURES.COM to give our INO readers a weekly recap of the Futures market. He has been Senior Analyst for close to 15 years and has extensive knowledge of all of the commodity and option markets.

Michael frequently appears on multiple business networks including Bloomberg news, Fox Business, CNBC Worldwide, CNN Business, and Bloomberg TV. He is also a guest on First Business, which is a national and internationally syndicated business show.

Gold Futures

Gold futures in the April contract settled last Friday in New York at 1,302 while currently trading at 1,310 up about $8 for the trading week. Prices reacted positively off of the Federal Reserve statement that they will not raise interest rates for the rest of 2019 which is a fundamental bullish factor towards gold and the precious metals as a whole. Gold prices held major support a couple of weeks back at the 1,280 level as I still believe we will break the February 20th high of 1,349 in the coming weeks ahead. The Federal Reserve stated that there would be no more interest rates hikes in the near future as that is bullish commodities and stock prices in general as I see no reason to be short gold at these relatively inexpensive prices. Gold futures are trading above their 20 and 100-day moving average as the trend is slightly higher as I will be looking at a bullish position if prices hit a four week high in next weeks trade as the chart structure is improving daily due to the low volatility. The U.S. dollar has sold off of recent highs as lower interest rates in the United States means a weak dollar which is also bullish gold.
TREND: HIGHER
CHART STRUCTURE: IMPROVING
VOLATILITY: AVERAGE

Continue reading "Weekly Futures Recap With Mike Seery"

Stocks Drop On Fears Of An Economic Slowdown

Hello traders everywhere. The move lower started early Friday in Europe when IHS Markit said that manufacturing activity in Germany dropped to its lowest level in more than six years in March. In France, manufacturing and services slowed down to their lowest levels in three months and two months, respectively. For the eurozone as a whole, manufacturing fell to its lowest level since April 2013. This data sent the German 10-year bund yield to their lowest level since 2016, briefly dipping into negative territory.

Once trading opened in the U.S. we got news that the spread between the 3-month Treasury bill yield and the 10-year note rate turned negative for the first time since 2007 - thus inverting the so-called yield curve - according to Refinitiv Tradeweb data. An inverted yield curve happens when short-term rates surpass their longer-term counterparts. This is considered a trustworthy indicator of a recession coming in the near future.

yield curve

These moves come after U.S. central bank surprised investors by adopting a sharp dovish stance on Wednesday, projecting no further interest rate hikes this year and ending its balance sheet roll-offs. Market sentiment was boosted by the Fed's updated outlook on interest rates, but the reasons behind it caused some concern.

Key Levels To Watch Next Week:

Continue reading "Stocks Drop On Fears Of An Economic Slowdown"