Each Week Longleaftrading.com will be providing us a chart of the week as analyzed by a member of their team. We hope that you enjoy and learn from this new feature.
As we start the week our attention turns to the September E-Mini S&P 500 (CME:ES.U14.E) as it looks to extend a 6 day winning streak. US equities have benefited from the dovish and accommodative tone from the FED last week. Existing home sales and manufacturing PMI data have added an additional boost to the market this morning. Coupled with last week’s support, the path of least resistance in the S&P 500 is a move higher. The primary concern that could spark profit taking in this market are the geopolitical risks surrounding the conflict in Iraq which has given early strength to the Crude Oil market.
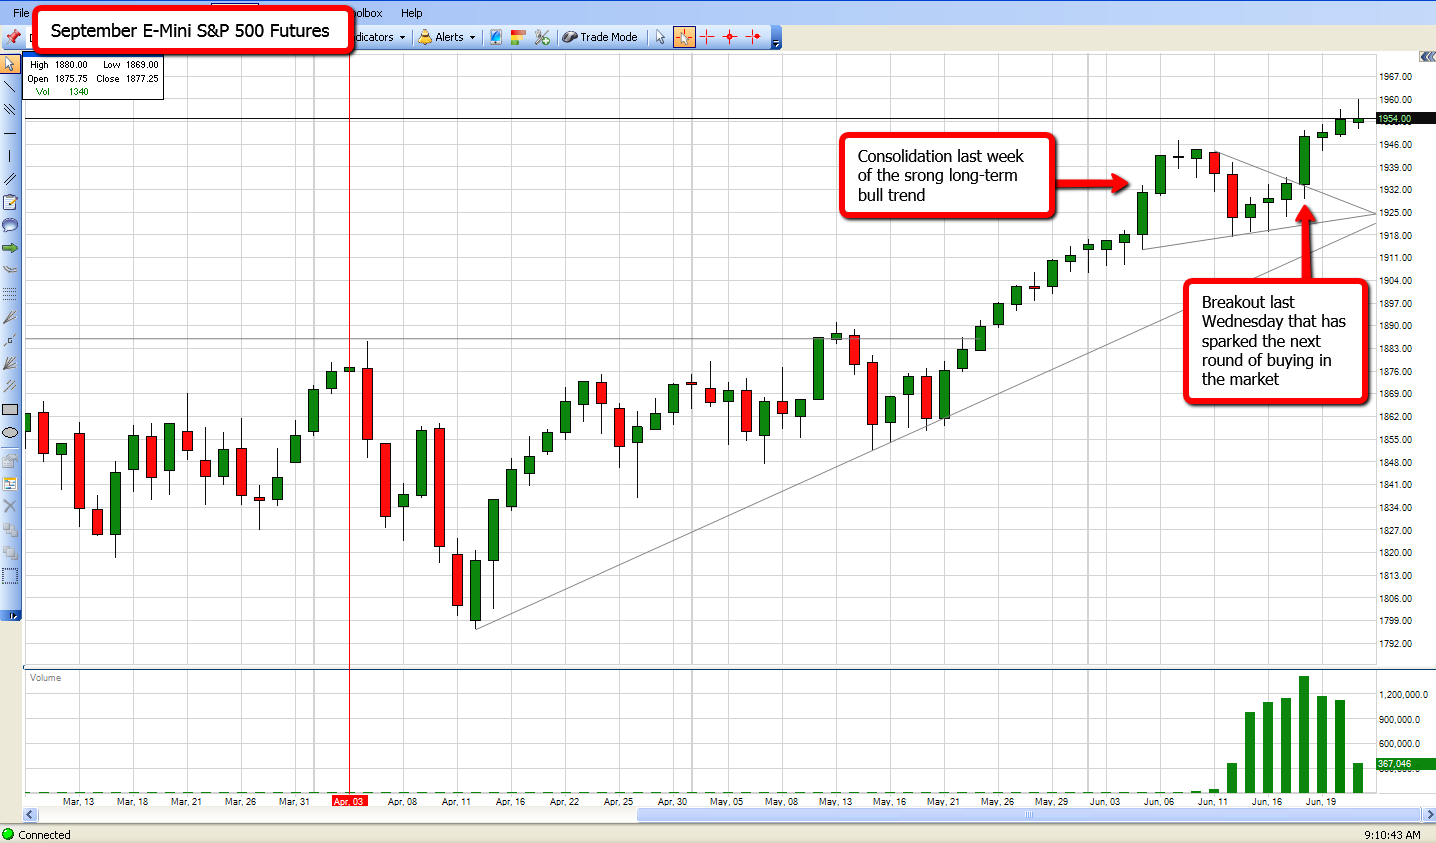
As we turn to the chart, last week we saw a breakout of a consolidation pattern in an overall strong bull trend last Wednesday, June 18. Since the breakout from this consolidation, the market has legged decisively higher to put in new all time high levels to close out last week. The market put in a new high print in the overnight session of 1959.75 and I expect this bullish momentum to continue this week. Continue reading "Chart of The Week - E-Mini S&P 500"