This ETF King Continues To Lose Funds

Year-to-date, the largest exchange-traded fund by assets under management, the SPDR S&P 500 ETF (SPY), has seen an astonishingly large amount of money flow out of the fund.

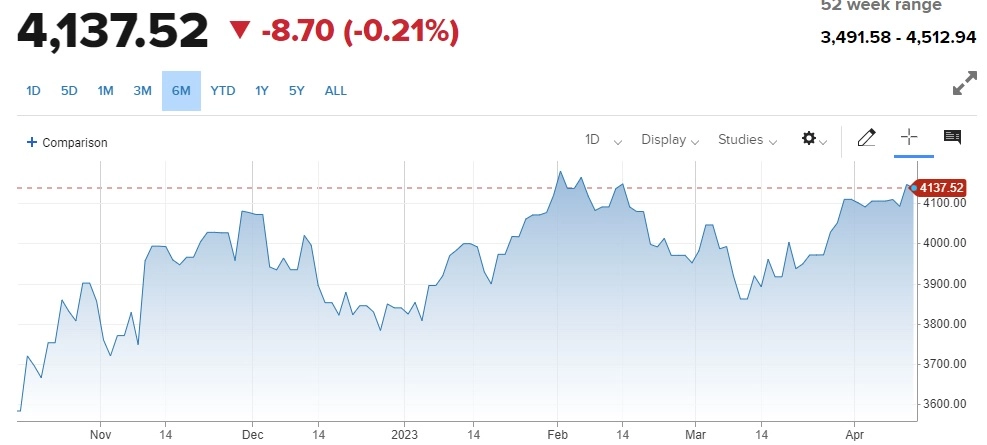
Remind you; this is also when the S&P 500, and thus SPY itself, is up 7.09% year-to-date. That is important to note because it highlights that the fund does not necessarily see money leave the fund when the market is getting hit.

The SPY has over $372 billion in assets under management, making it the single largest ETF. SPY also holds the crown of being the most liquid, which may not mean much to the average investor, but that is very important to Wall Street professionals and prominent investment managers.

Liquidity is important because it means these investment managers can get in and out of positions with no genuine concern about whether or not there is a buyer or seller on the other side of their trade.

So how much money has SPY seen leave since the start of 2023? $9.43 billion!

Let that sink in and think about the fact that only about 150 Exchange-traded funds in the US have more than $9 billion in assets under management. That is 150 out of the 3,126 ETFs that investors have to pick from.

SPY lost more assets in three and a half months than nearly 3,000 funds have period.

Why is the money flowing out of SPY?

Unlike during other times when we see significant outflows of ETFs, so far in 2023, it has not been because the market is declining. Typically when the market is in a downturn, we see outflows occur as investors pull their money from risk assets and put it into reduced-risk assets. Think about pulling money out of stocks and putting it into bonds. Continue reading "This ETF King Continues To Lose Funds"

Is The Dollar Headed Into The Abyss?

Back in January, I attempted to answer the question “Is Dollar's Dominance Over?”, as the dollar index (DX) had experienced significant losses.

However, we received two conflicting signals from the technical chart, which provided a bearish alert, and the interest rate differentials chart, which indicated support for the dollar.

In both polls, the majority of readers voted that the dollar's dominance was over and that it had already peaked for the dollar index.

Since then, the DX has made a bounce close to $106 with the support of a hawkish Fed, however these gains proved to be unsustainable, and the price dropped back down to hit the valley established in January, reaching a new low of $100.

Is the dollar headed right into the abyss?

Let's take a look at some updated charts, starting with the interest rate differentials.

DX vs Real Interest Rates

Source: TradingView

This time, I will be using a monthly time frame to provide a closer look at what could potentially cause the dollar to decline. Continue reading "Is The Dollar Headed Into The Abyss?"

Bull or Bear or Neither?

Please enjoy this updated version of weekly commentary from the Reitmeister Total Return newsletter. Steve Reitmeister is the CEO of StockNews.com and Editor of the Reitmeister Total Return.

Click Here to learn more about Reitmeister Total Return


Six months ago, stocks made fresh lows of 3,491. Since then, we have seen a hefty bounce to our current `perch at 4,137.

So are we in still in a bear market…or has the new bull emerged?

That vital discussion, along with our trading plan with top picks, will be at the heart today’s commentary.

Market Commentary

Technically speaking we are still in a bear market. That is because the definition of a new bull market is when the S&P 500 (SPY) rises 20% from the lows. Here is that math:

3,491 October Lows x 20% = 4,189

However, some will say that was only an intraday low and more appropriate to measure based upon the closing low of 3,577 set on October 12. That would mean stocks would need to break above 4,292 to be considered in bullish territory.

The point is that we are getting closer to a bullish breakout. Yet where we stand at this precise moment is a state of limbo which is what creates a trading range.

One could say it’s as wide as the recent lows of 3,855 up to 4,200. But I think most of the near future will be spent in a tighter range of 4,000 to 4,200.

SP500 Continue reading "Bull or Bear or Neither?"

Buy-The-Dip Stocks For Silver Exposure

For the past two years, investors in the precious metals complex have watched nearly every commodity race higher, with oil, coffee, orange juice and copper up significantly from their 2021 lows.

Unfortunately, gold (GLD) and silver (SLV) were both left in the dust after topping in August 2020 and February 2021, respectively.

And for investors looking for leverage to the metals, the corrections were even more painful in the mining stocks, with the GDX sliding over 50% from its highs above $45.00 per share set in August 2020.

Fortunately, we’ve since seen a reversal to this trend. Not only is gold knocking on the door of a new all-time high, but silver is outperforming over the past month, up over 35% from its lows after making a new year-to-date high above $25.00/oz.

This has lit a fire under several silver miners, with their margins set to improve by over 50% based on AISC margins of ~$6.00/oz in FY2022, and the potential to enjoy margins closer to $9.00/oz if the silver price averages $25.00/oz this year.

In this update, we’ll look at two silver miners that are still trading well off their 2020/2021 highs and look to be solid buy-the-dip candidates:

Pan American Silver (PAAS)

Pan American Silver (PAAS) is a $7.0 billion gold and silver producer with a production profile of approximately ~1.5 million gold-equivalent ounces [GEOs] after acquiring Yamana’s South American assets last year.

This makes it one of the largest producers sector-wide and the acquisition solidifies its spot as a top silver producer, with the company expected to produce ~28 million ounces of silver in 2024, and this excludes the massive Escobal Mine which has the potential to produce ~20 million ounces of silver if it is restarted. Continue reading "Buy-The-Dip Stocks For Silver Exposure"

What Happened To Reducing The Fed’s Balance Sheet?

Over the past year the Federal Reserve has driven up interest rates by nearly 500 basis points in its quest to try to tamp down inflation.

From a range of 0.25%-0.50% back on March 17, 2022, the Fed since then has steadily raised its target for its benchmark federal funds rate to 4.75%-5.00%, with the possibility of more to come. Over that time the Fed has raised rates nine times—four times by 75 basis points, twice by 50 bps, and three times by 25 bps.

At its two most recent meetings, in February and March, the Fed raised rates by only 25 bps each, possibly because it saw fit to take a slight pause and measure the effect of all these rate increases to see if they are having the desired effect of slowing the economy in order to bring down inflation.

Of course, as we know, the rate hikes haven’t done a whole lot in reining in inflation.

Rather, they created a panic among some fairly large regional banks that has unsettled the entire banking industry, the effect of which has done more to slow the economy than raising rates has done.

Should the Fed then say that the ends justify the means, even if the means—creating the panic—were totally accidental? Should the Fed now brand its “policy normalization” program a success even if a couple of banks failed in the process? Let’s hope not.

This fiasco does call attention to the other prong of that normalization process, namely a reduction in the Fed’s massive balance sheet, which was supposed to help raise long-term interest rates gradually and lessen the Fed’s presence in the U.S. economy.

On that score, there has been negligible progress.

Back in the good old days, before the 2008 financial crisis, the Fed’s balance sheet never totaled more than $1 trillion, a figure that now looks fairly quaint, yet it was a mere 15 years ago. Continue reading "What Happened To Reducing The Fed’s Balance Sheet?"