Global Tensions Add Stress To Tense Stock Market

Hello traders everywhere. After what felt like a small positive victory on Friday has quickly subsided after we woke up this morning to news of growing global tensions with Saudi Arabia and yet another sell-off in the tech sector, a falling dollar, and treasuries.

The dollar is trading near a two-week low against its peers after U.S. retail sales disappointed in September. West Texas crude oil traded around $71 a barrel, less than a dollar away from issuing a red weekly Trade Triangle, amid tensions between Saudi Arabia and the U.S. over the disappearance of a prominent journalist and gold is headed toward its fourth advance in five days.

200-day moving average

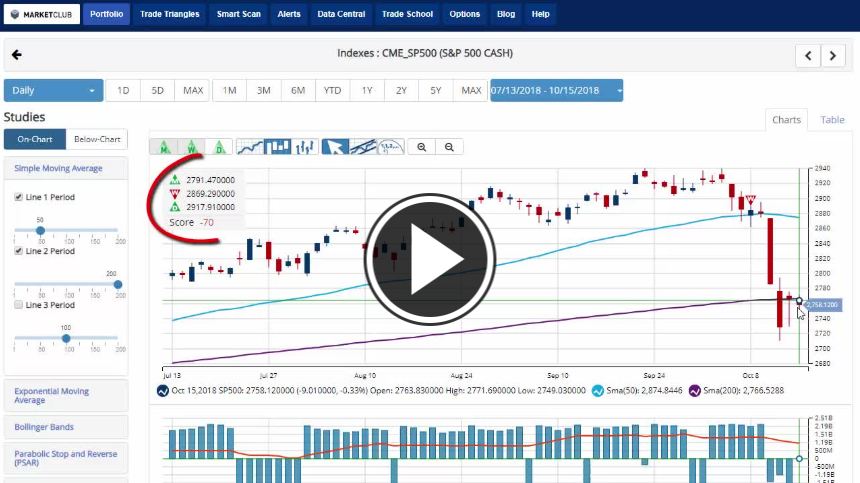
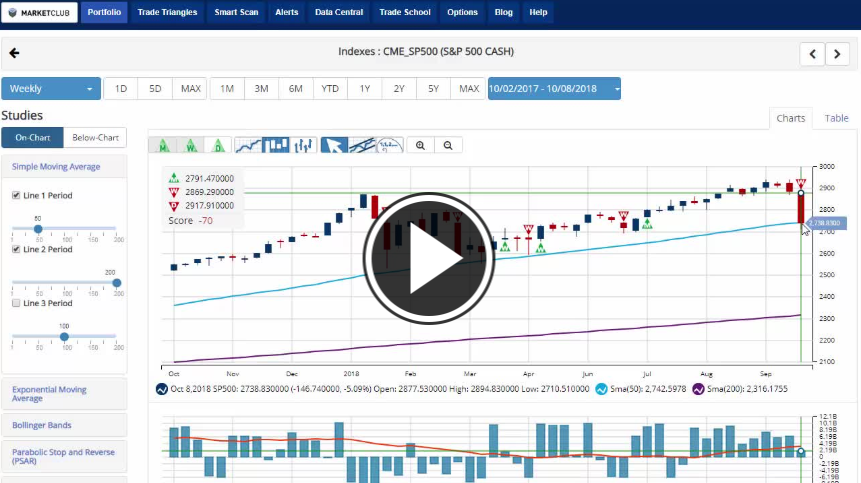
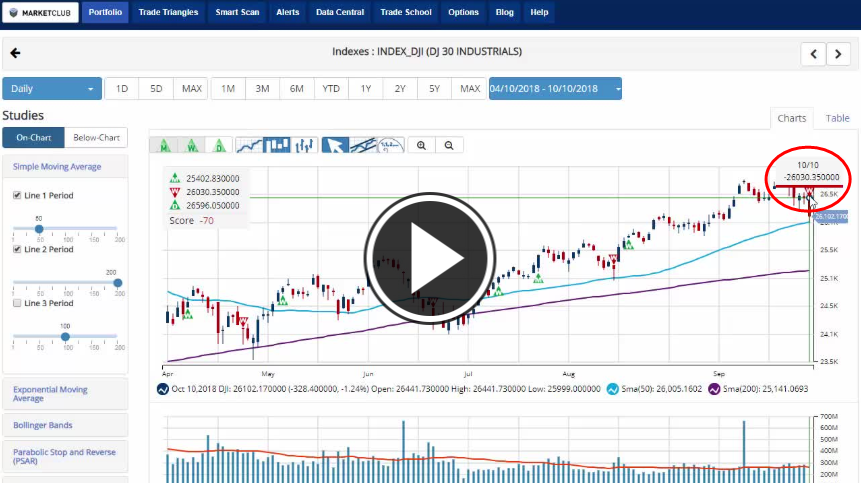
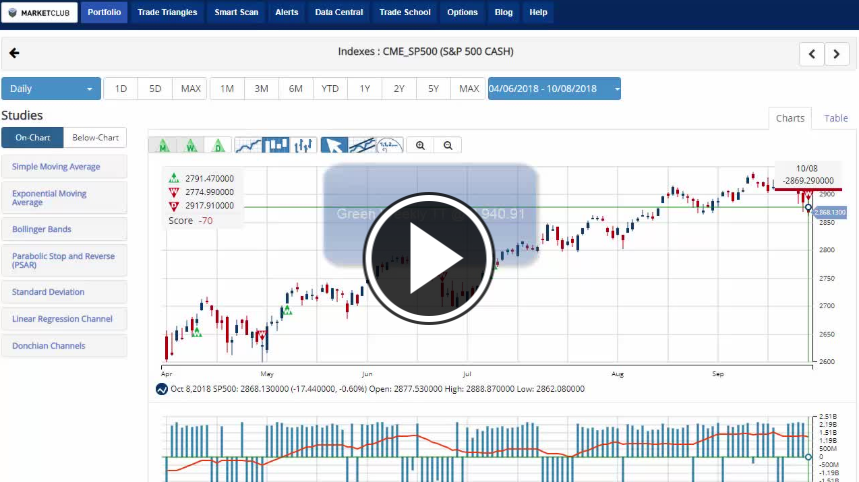
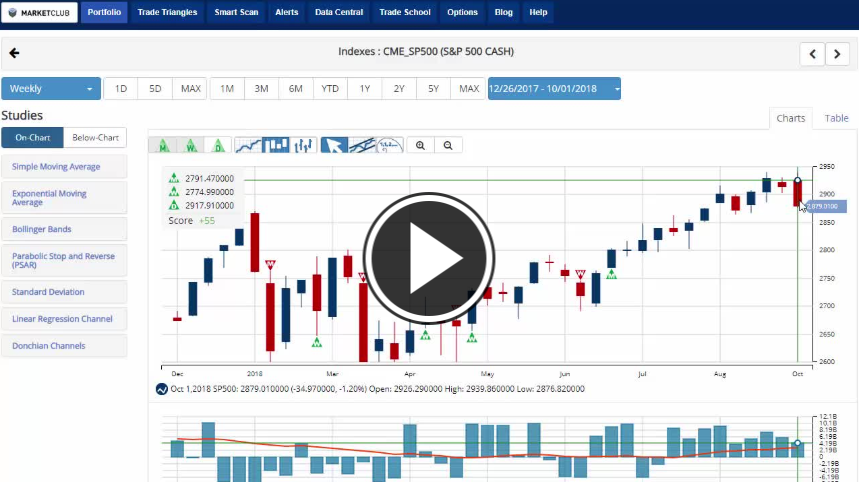
The DOW was in positive territory for most of the morning trading above its 200-day moving average, the only index to do so, but has slipped into negative territory this afternoon. Both the S&P 500 and NASDAQ are both trading below their 200-day moving average after opening the week in negative territory. While the NASDAQ has already triggered a new red monthly Trade Triangle the S&P 500 is holding on at the moment, but that could change if it continues to trade below the 200-day Moving Average. Continue reading "Global Tensions Add Stress To Tense Stock Market"

Stocks Fight Back After Two Day Slump

Hello traders everywhere. We were due for a rebound off the lows this week, and that's just what we got on Friday at the open with the stock market posting gains over 1% at the highs across the board with technology and other high-growth stocks leading a fight back. While today's gains are an excellent way to end the week if they hold, we need to remember that overall all three indexes are still down over 4%, that marks the third biggest weekly loss this year.

Stocks Fight Back

The NASDAQ lost over 4.8% on the week and issuing a new red monthly Trade Triangle at 7,443.10 signaling a possible long-term short position, but surprisingly it hasn't lost the most this week. That honor belongs to the DOW which stands to lose over 5%, issuing a red weekly Trade Triangle signaling a move to the sidelines. There is still quite a bot of room to go before a red monthly Trade Triangle would appear. The S&P 500 is down 4.9%, and much like the DOW issued a new red weekly Trade Triangle signaling a move to the sidelines. Continue reading "Stocks Fight Back After Two Day Slump"

Dow Jones Industrial Joins Sell-Off Party

Hello traders everywhere. The Dow Jones Industrial finally succumbed to the pressure of the current market sell-off issuing a red weekly Trade Triangle at 26,303.35 after falling -431 points at it's lowest level in morning trading approaching the 50-day moving average which stands at 26,004.22. The move lower came after the DOW had been relatively unchanged the last couple of days as both the S&P and NASDAQ were under heavy selling pressure. All three indexes are currently trading down over -1.3% on the day.

Dow Jones Industrial

The S&P 500 opened trading below its 50-day MA, that move lower came after the S&P briefly broke the 50-day MA yesterday. As it stands right now, the S&P is on track to post its worst weekly losing streak in a little over two years standing at three weeks. The next level of support to keep an one will be the 200-day MA standing at 2,765.77. A move below that level could signal a steeper sell-off.

Meanwhile, the NASDAQ continues to get pummeled as the tech sector is seeing the most significant losses. The NASDAQ is on pace to have it's the worst trading month since January of 2016. Key support lies at the 7,449.62 which is where the 200-day MA is. A move right below that level (7,443.10) will trigger a new red monthly Trade Triangle signaling a move lower is ahead.

Key Levels To Watch This Week:

Continue reading "Dow Jones Industrial Joins Sell-Off Party"

A Fear Of Rising Interests Rates

Hello traders everywhere. A fear of rising interest rates is what is driving the latest sell-off in the stock market which is gaining steam for the third straight day. Interest rates were on a tear last week after the release of several pieces of strong economic data. The benchmark 10-year Treasury note yield rose to above 3.2% from around 3.06%. The 10-year yield also hit its highest level since 2011 last week and even though the U.S. Treasurys are not trading today in honor of Columbus Day that move has had a lasting effect.

A fear of rising interest rates

The S&P 500 triggered a new red weekly Trade Triangle joining the battered NASDAQ while only the DOW remains in an uptrend. The DOW remains resilient, but how long can it fight off the downward pressure?

Crude oil and gold both issued new red daily Trade Triangles with oil posting its Trade Triangles in late trading on Friday moving to a sidelines position with both the weekly and monthly Trade triangles remaining green. Gold posted its red daily Trade Triangle in late trading Sunday night resuming the long-term downtrend that has been in play since April when the monthly Trade Triangle turned red.

Key Events To Watch This Week:

Continue reading "A Fear Of Rising Interests Rates"

Back To Back Losses To End Week

Hello traders everywhere. What looked to be another record-setting week mid-week has turned ugly the last couple of days with the DOW posting back to back 200 point losses to end the week and finishing down over -.3% on the week. The S&P 500 and NASDAQ will both have two daily losses to end the week with the S&P losing over -1% and the NASDAQ losing over -3.5%, triggering a new red weekly Trade Triangle, as the tech sector is experiencing yet another sell-off.

Back To Back Losses

The recent weakness can be attributed to the mixed jobs report that shows a tightening job market that is pushing interest rates higher. The U.S. economy added 134,000 in September, well below the expected gain of 185,000. However, the U.S. unemployment rate fell to its lowest level since 1969. Job gains for August also received a sharp upward revision to an addition of 270,000 jobs from 201,000. Wages, meanwhile, grew by 2.8% last month on a year-over-year basis to match expectations.

The 10-year note yield rose to 3.227% and hit a fresh 2011 high while the two-year note yield advanced to 2.897%. Yields have been on the rise this week amid strong economic data.

Key Levels To Watch Next Week:

Continue reading "Back To Back Losses To End Week"