World Oil Supply And Price Outlook, November 2020

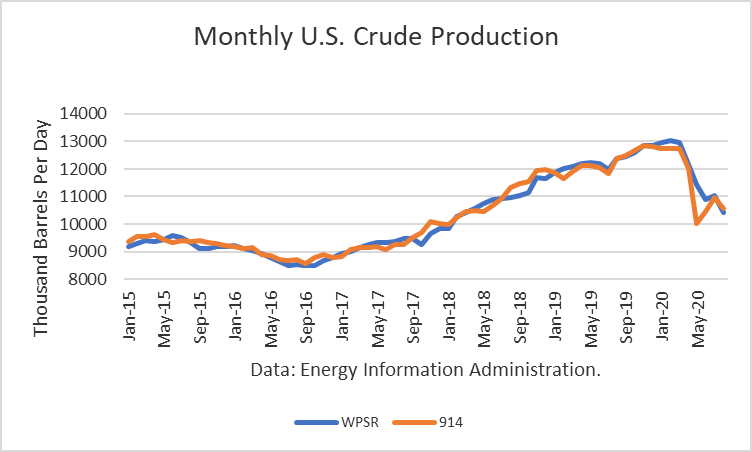
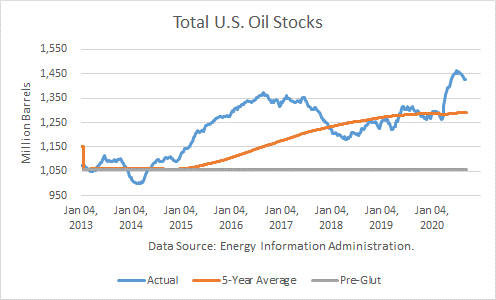
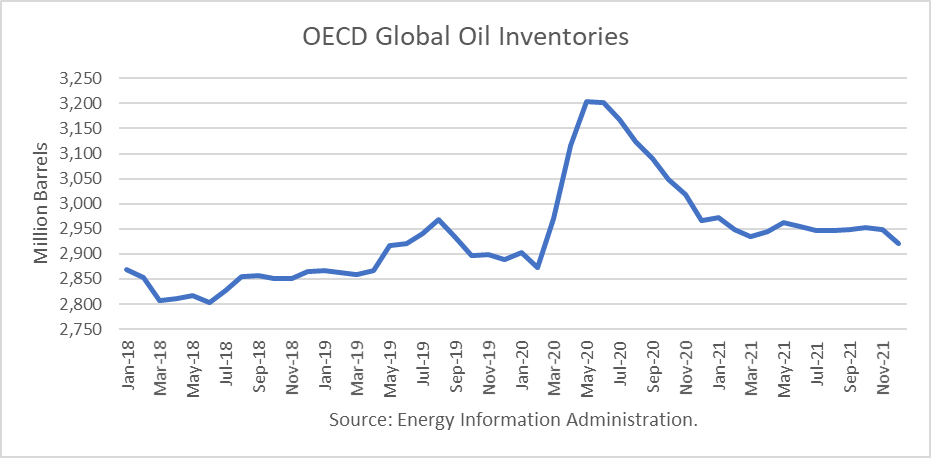
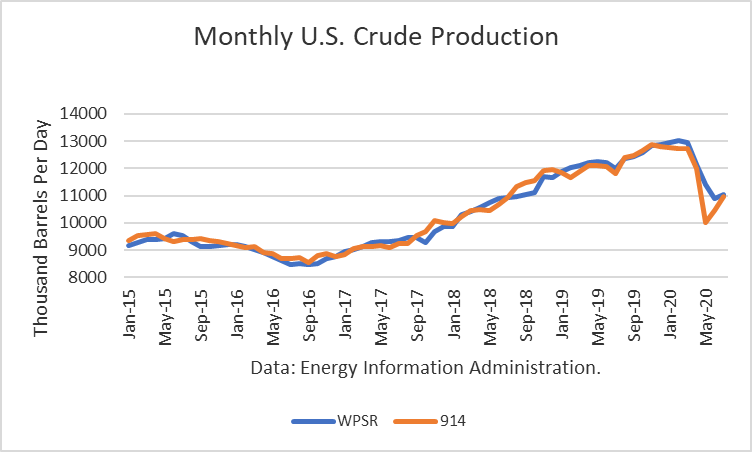
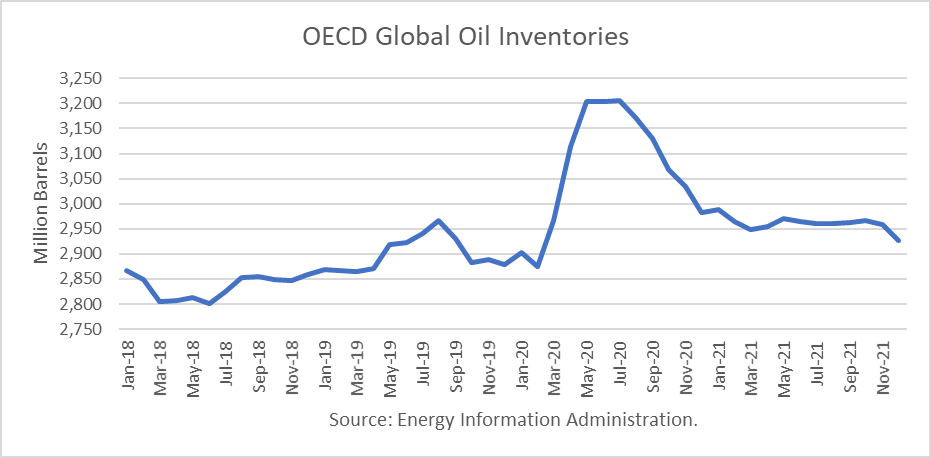
The Energy Information Administration released its Short-Term Energy Outlook for November, and it shows that OECD oil inventories likely bottomed in this cycle in June 2018 at 2.802 billion barrels. Stocks peaked at 3.205 billion in July 2020. In October 2020, it estimated stocks dropped by 62 million barrels to end at 3.069 billion, 189 million barrels higher than a year ago.

The EIA estimated global oil production at 91.89 million barrels per day (mmbd) for October, compared to global oil consumption of 95.31 mmbd. That implies an undersupply of 3.42 mmbd or 106 million barrels for the month. About 45 million barrels of the draw for October is attributable to non-OECD stocks.

For 2020, OECD inventories are now projected to build by net 104 million barrels to 2.982 billion. For 2021 it forecasts that stocks will draw by 55 million barrels to end the year at 2.927 billion.

Oil Supply

The EIA forecast was made incorporates the OPEC+ decision to cut production and exports. According to OPEC’s press release: Continue reading "World Oil Supply And Price Outlook, November 2020"

U.S. Crude Production Fell In August

The Energy Information Administration reported that August crude oil production fell by 401,000 barrels per day, averaging 10.579 mmbd. This follows a 538,000 b/d rise in July and a 2 million barrel per day collapse in May. The August 914 figure compares to the EIA’s weekly estimates (interpolated) of 10.429 mmbd, a figure that was 150,000 b/d lower.

Monthly US Crude Production

The primary cause of the drop in production was disruptions in the U.S. Gulf Coast due to hurricane activity. USG production dropped by 453,000 b/d from July, and Texas output fell 49,000 b/d, while Louisiana fell by 17,000 b/d.

Rebounds were largest in North Dakota (126,000 b/d) and New Mexico (27,000). Given the huge reduction in May and this reduction in August, production dropped by 1.806 mmb/d over the past 12 months. This number only includes crude oil. Other supplies (liquids) that are part of the petroleum supply rose by 130,000 b/d from a year ago. Continue reading "U.S. Crude Production Fell In August"

Hurricane Causes Modest Crude Stock Draw

According to the Energy Information Administration, U.S. crude inventories (excluding SPR) fell by 7.2 million barrels last week to 1.395 billion, and SPR stocks dropped by 0.8 million barrels. Total stocks stand 101 mmb above the rising, rolling 5-year average and about 122 mmb higher than a year ago. Comparing total inventories to the pre-glut average (end-2014), stocks are 336 mmb above that average.

Crude Oil

Crude Production

Production averaged 9.9 mmbd last week, off 600,000 b/d from the prior week due to the hurricane impact on USG operations. It averaged 10.525 mmbd over the past 4 weeks, off 16.1 % v. a year ago. In the year-to-date, crude production averaged 11.645 mmbd, off 4.5 % v. last year, about 500,000 b/d lower. Continue reading "Hurricane Causes Modest Crude Stock Draw"

World Oil Supply And Price Outlook, October 2020

The Energy Information Administration released its Short-Term Energy Outlook for September, and it shows that OECD oil inventories likely bottomed in this cycle in June 2018 at 2.804 billion barrels. Stocks peaked at 3.204 billion in May 2020. In September 2020, it estimated stocks dropped by 34 million barrels to end at 3.090 billion, 123 million barrels higher than a year ago.

The EIA estimated global oil production at 91.70 million barrels per day (mmbd) for September, compared to global oil consumption of 95.26 mmbd. That implies an undersupply of 3.56 mmbd or 110 million barrels for the month. About 76 million barrels of the draw for September is attributable to non-OECD stocks.

For 2020, OECD inventories are now projected to build by a net 87 million barrels to 2.967 billion. For 2021 it forecasts that stocks will draw by 46 million barrels to end the year at 2.921 billion.

Crude Oil

The EIA forecast was made incorporates the OPEC+ decision to cut production and exports. According to OPEC’s press release: Continue reading "World Oil Supply And Price Outlook, October 2020"

Crude Oil Outlook Is Highly Uncertain

The Energy Information Administration reported that July crude oil production rebounded by 538,000 barrels per day, averaging 10.984 mmbd. This follows a 427,000 b/d rise in June and a 2 million barrel per day collapse in May. The July 914 figure compares to the EIA’s weekly estimates (interpolated) of 11.045 mmbd, a figure that was 61,000 b/d higher.

Crude Oil

Rebounds were largest in North Dakota (157,000 b/d), Texas (103,000), Gulf of Mexico (85,000), Alaska (83,000) and New Mexico (42,000). Given the huge reduction in May, production dropped by 864,000 b/d over the past 12 months. This number only includes crude oil. Other supplies (liquids) that are part of the petroleum supply rose by 70,000 b/d from a year ago. Continue reading "Crude Oil Outlook Is Highly Uncertain"