
The previous post “Golden Pattern For Silver, Not Gold” from December highlighted a bullish pattern called the 'Golden Cross' that appeared on the daily chart of silver futures. This occurred when the 50-day moving average crossed over the 200-day moving average.
While the majority of readers considered this signal to be reliable, they did not expect the price of the metal to rise above $30.
The following daily chart will show how the pattern has played out since then.
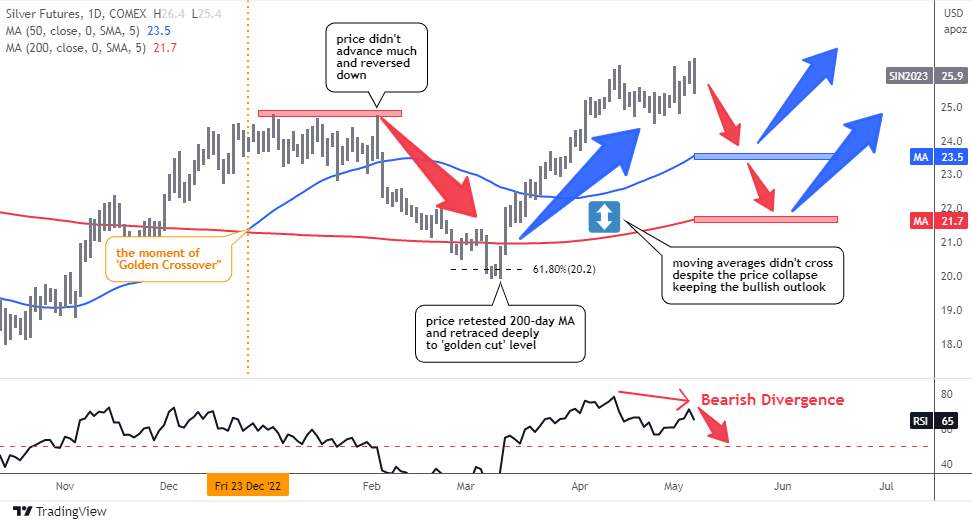
When the ‘Golden Cross’ signal was posted, the price of silver futures was at $23.9 (marked by the orange vertical line), and it went up almost $1 to reach $24.8 before stalling for over a month.
The price was unable to break above this new high and subsequently collapsed, dropping below the blue 50-day MA and testing the red line of the 200-day MA, briefly breaking through to reach the ‘golden cut’ Fibonacci retracement level of 61.8% at around $20. Continue reading "Silver Update: Roller Coaster Ride"