Here's Why Stocks Rallied Last Week

I don't know about you, but right now, I'm breathing a little sigh of relief.

And with good reason. Finally last week, we got some good news out of stock market action. And pretty much across the board, the news was positive. Here’s what I mean:

Stock

Source

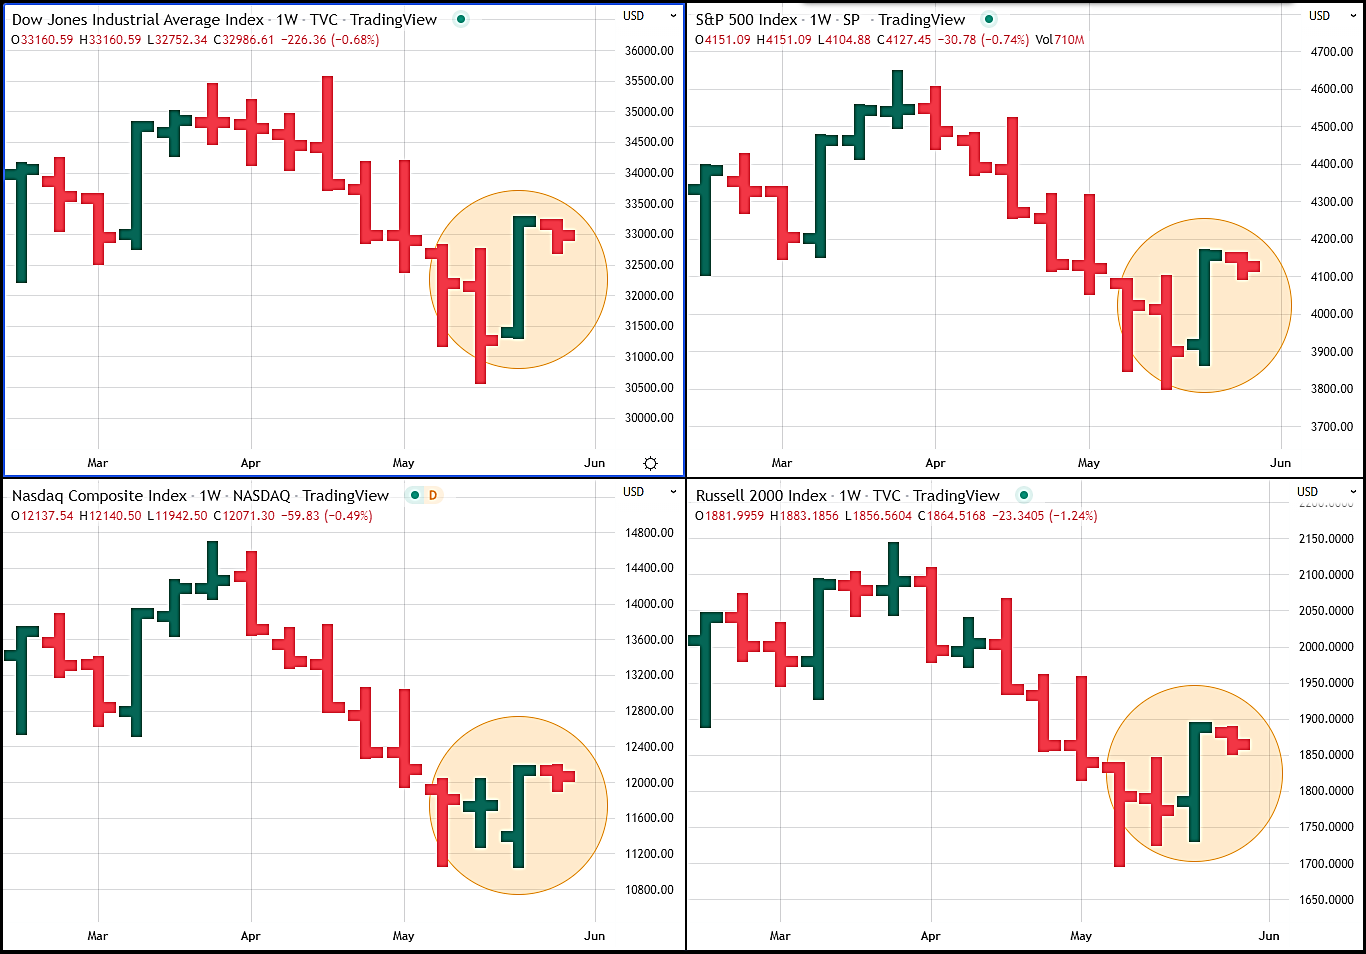
As you can see from this set of multiple weekly charts, stocks booked some decent action last week. In fact, the Dow was up 6.2% for the week. Meanwhile, the S&P 500, a good proxy for the broader stock market, was up 6.6%. Also, last week, the Nasdaq was up 6.8%, and the Russell 2000, a good indicator of what all stocks are doing, was up 6.5%.

You have to admit that's broad positive action across all equity asset classes. And it's welcome news considering what the markets have been up to over the past two months. Continue reading "Here's Why Stocks Rallied Last Week"

Here's Why Stocks And Bitcoin Are Down

First off, I don’t have to tell you that if you've invested in the stock market, the last couple of months has been downright terrible.

In fact, since the beginning of the year, major stock indexes of every ilk are down. Take a look:

Stocks and Bitcoin

Source

As you can see from this chart, just about everywhere you turn, stocks are getting hammered. Since the beginning of the year, the S&P 500, a good proxy for the broader stock market, is down 16%, the Dow 30 is down 11%, and the tech-heavy NASDAQ is down a whopping 26%. No matter how you slice it, that’s awful. Continue reading "Here's Why Stocks And Bitcoin Are Down"

The Truth Behind The Tech Selloff

There’s no doubt about it: Tech stocks have taken it on the chin lately. In fact, the tech sector (NASDAQ) is down 22% since the beginning of the year. That’s a terrible start to the year, no matter how you slice it.

And inside tech, there’s nowhere to hide. Even the biggest and brightest are getting hammered. See for yourself:

Tech

Source

This chart shows the year-to-date performance of the stars of tech, the so-called FAANG stocks. The acronym stands for the five prominent players in tech, including Meta (FB), Amazon (AMZN), Apple (AAPL), Netflix (NFLX), and Alphabet (GOOG). Included in the chart is also the performance of the NASDAQ. (Apple was originally excluded from the FAANG club but was added in 2017).

The details are gruesome. Since the beginning of the year, Meta is down 39%, Amazon is down 29%, Apple is down 15%, Netflix is down 67%, and Alphabet is down 20%. All told, those are bone-crushingly bad numbers. Continue reading "The Truth Behind The Tech Selloff"

Here's How to Handle Inflation

I have to admit I almost fell out of my chair when I dug deep into the latest inflation numbers. Compared to a year ago, prices are up a jaw-dropping 8.5%. And in March alone they grew 1.2%. That’s the biggest single-month increase in the last 6 months. And if you look at the trend since the last year, those monthly increases are getting bigger, not smaller.

But that’s not all. If you take a stroll down the different components of the price increases, there’s pretty much nowhere to hide. Compared to a year ago, food is up 9%, used cars and trucks are up 35%, gas is up 48%, and fuel is oil up a mind-numbing 70%. Here are the grisly details in chart form:

Inflation

Source

As you can see from this chart, top-line inflation is at multi-year highs. In fact, the 8.5% year-ago increase in March is the biggest 12-month increase since December 1981.

Now, take a look at the same chart, but the more volatile food and energy components stripped out: Continue reading "Here's How to Handle Inflation"

Bitcoin Tested By Uncertainty... And Wins!

I probably don’t have to tell you that no matter where you turn these days, there’s one thing you can be certain of.

Uncertainty.

That’s right. There’s a ton of uncertainty no matter where we turn. And that’s true, as a matter of fact, in our daily lives: While we try to make things as predictable and certain as possible, in the end, we’re all just flat-out exposed to uncertainty.

It’s also true when it comes to our investments in gold (GC1), stocks (SPX), tech (NASDAQ), and Bitcoin (BTC). In fact, that uncertainty is even more at play. See for yourself.

Bitcoin Daily Chart

As you can see from this chart of gold, stocks, and tech, every asset has had its fair share of volatility over the past year. In fact, the performance of gold, stocks, and tech have ranged from 18% to the upside (gold) to -9% to the downside (tech) during the last one-year performance period. Lumping all those assets together, that’s a net swing of 27% from top to bottom. Whew!
But when you throw Bitcoin into the mix, it’s clear that BTC makes that uncertainty look like a walk in the park. Why? Because over the same one-year performance period, Bitcoin has ranged from 13% to the upside (Nov 2021) to -50% to the downside (July 2021). That’s a net swing of 63% from top to bottom or about 2.3 times the performance volatility of gold, stocks, and tech. Continue reading "Bitcoin Tested By Uncertainty... And Wins!"