Are We or Are We Not in a New Gold Bull Market?

Technical analyst Jack Chan has examined the charts and says that if we are in a new bull market, prices in both gold and gold equities should begin to pull back and consolidate soon.

As suggested in our previous analysis, we need to see a couple of things happening in order to welcome a potential new bull market:

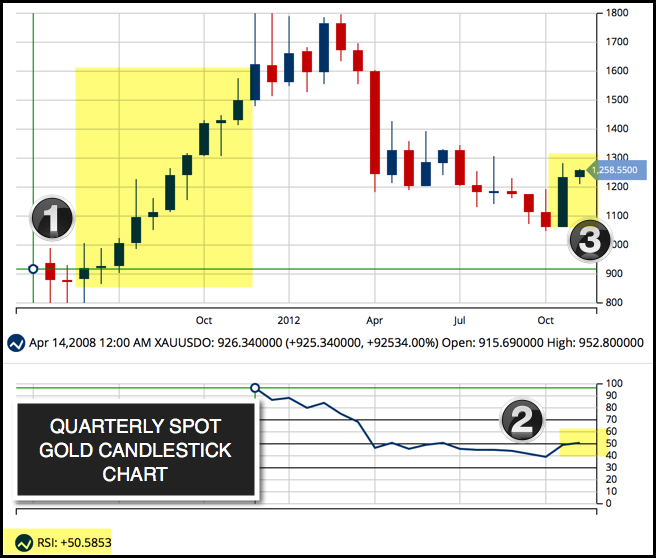
#1. COT data to return to bull market values.
#2. Gold price to exceed the 2015 high at $1,302.

Nobody can predict when this will happen, but we can prepare by looking at the past bull and bear markets so that we can recognize a new bull market if and when it materializes.

The Bear Market From 1981 to 2001

Gold Spot Price

After topping above $700 in 1981, gold lost more than half of its value in just over a year, followed by two sharp bear market rallies, and then died a slow death over the next 12 years. Continue reading "Are We or Are We Not in a New Gold Bull Market?"

One Thing You May Have Missed About Apple

Hello MarketClub members everywhere, Adam Hewison here coming here from the digital studios of MarketClub. I just got back from a short vacation break in Maui to see Apple once again slumped below $100 a share.

MarketClub's Mid-day Market Report

Apple Inc. (NASDAQ:AAPL): One thing you may have missed is the fact that the Trade Triangles triggered a red weekly Trade Triangle on 4/22 at $104.22 signaling a move to the sidelines - that was 4 days ago!

As I have said before, perception is everything in the market; the perception now is that Apple is not the innovator it once was and that the smartphone business has peaked. On the brighter side, Apple still has almost $250 billion in cash, but like I said perception trumps everything. Continue reading "One Thing You May Have Missed About Apple"

Waiting On The Fed, GDP Results And Apple Earnings

The markets will be watching the Fed closely, looking for the central bank's latest decision on interest rates (although no one expects a change), there's also new GDP estimates for the markets to chew on.

Meanwhile, there are corporate earnings to think over, with Apple headlining a week of major earnings announcements. And, the presidential candidates continue to battle for votes and delegates with 5 states up for grabs on Tuesday. With all of that mind, let's take a look at the markets.

MarketClub's Mid-day Market Report

Key levels to watch this week:
S&P 500 (CME:SP500): 2,033.80
Dow (INDEX:DJI): 17,484.23
NASDAQ (NASDAQ:COMP): 4,808.91
Gold (FOREX:XAUUSDO): 1,214.70
Crude Oil (NYMEX:CL.M16.E): 36.57

Every Success,
Jeremy Lutz
INO.com and MarketClub.com

Energy Is The Name Of The Game

Hello MarketClub members everywhere. Many large, well-known energy companies triggered major buy signals yesterday based on green monthly Trade Triangles. In today's video, I will be looking at three energy stocks tied to crude oil which also gave buy signals yesterday. There is still a little bit of resistance just above the market in crude oil, but I expect that to be taken out and for oil to move to the upside in the days and weeks ahead.

MarketClub's Mid-day Market Report

Here are the three stocks that I will be analyzing today. Continue reading "Energy Is The Name Of The Game"

All Aboard The Gold Train

Yesterday, the Trade Triangles issued a green weekly Trade Triangle for gold. Gold (FOREX:XAUUSDO) now has three green Trade Triangles indicating that it's ready for the next upward leg in this long-term bull market.

As I have pointed out before, this quarter is the highest-rated quarter with an 83% success rate for gold trades using the Trade Triangles. Let me just be clear that this does not mean that this particular trade is guaranteed to be successful, but the odds are heavily in your favor.

I've added two charts below, a daily chart and a quarterly chart to illustrate the last time gold was in a prolonged bull market. That bull market started in Q1 of 2009 and continued for 11 quarters ending in April 2011. On the quarterly chart, you will see that every quarter for those 11 quarters the market closed higher than the previous quarter. If that same scenario plays out again, gold has 9 quarters to go.

Quarterly Chart of Gold (FOREX:XAUUSDO)

Key To Quarterly Chart

1) The start of the 11-quarter bull market
2) The RSI indicator moves to its highest levels in 3 years
3) Gold is 2 quarters into a long-term bull market

While the quarterly chart gives us a view of the big picture of how gold has acted in the past, the daily chart shows you how to use the Trade Triangles. For intermediate-term trading, you use the weekly Trade Triangle, which we just had a signal with yesterday, as the trend indicator and the daily Trade Triangle for exit and entry signals. If you are a long-term trader, then you want to rely on the monthly Trade Triangle, which has been positive for quite some time. Continue reading "All Aboard The Gold Train"