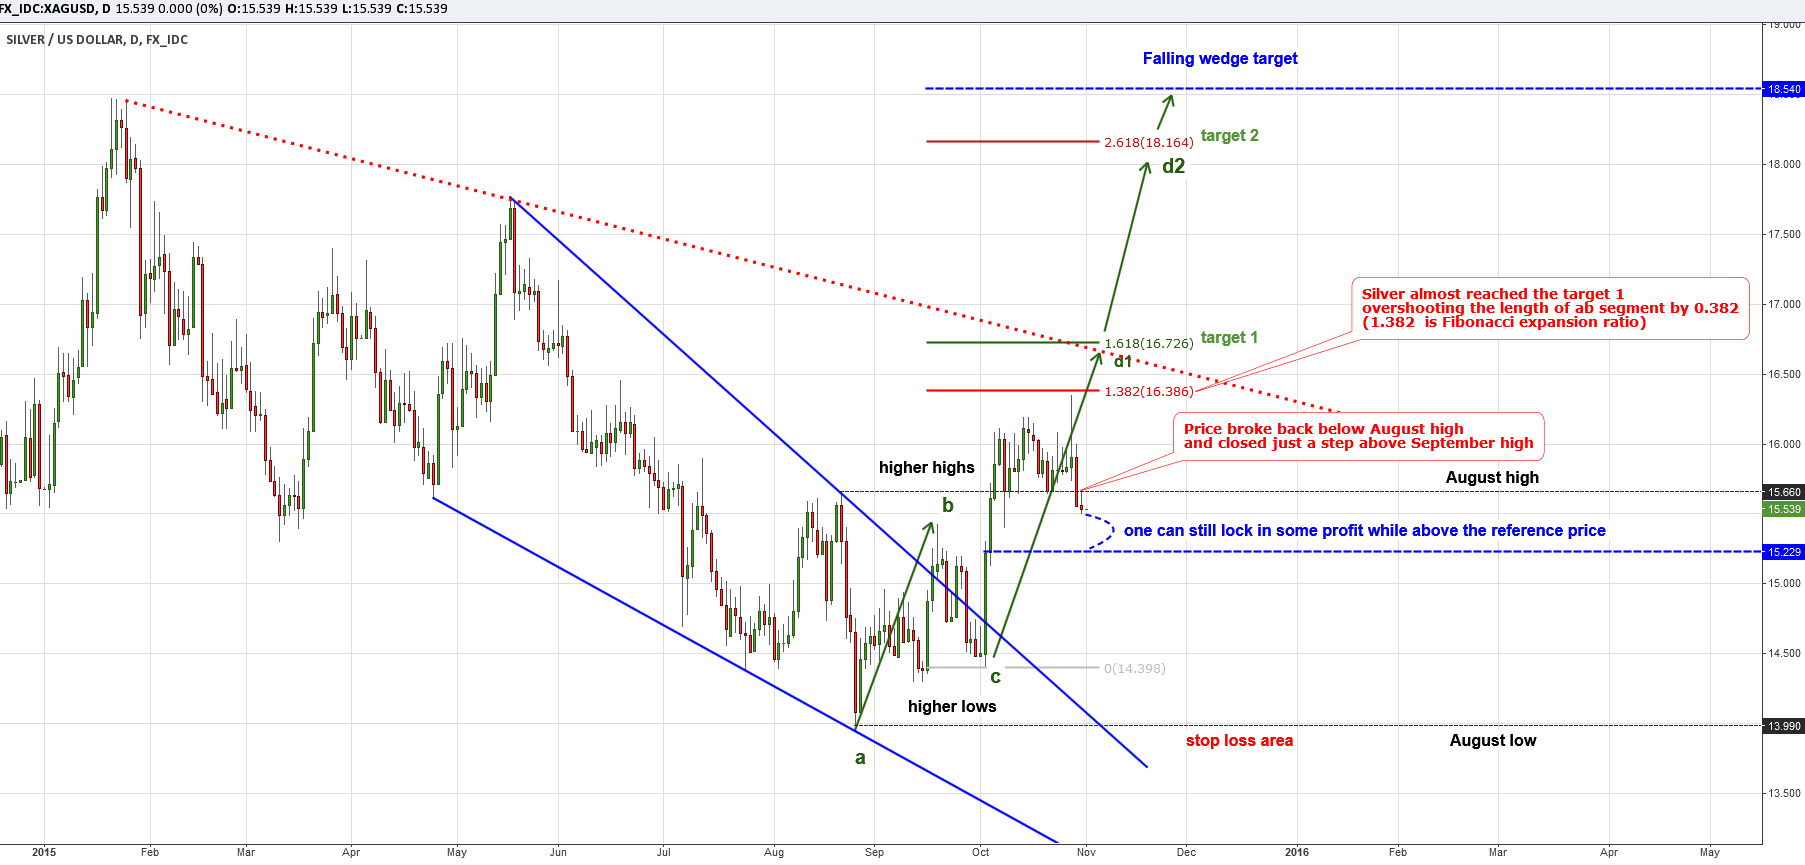
Silver started October with a long bullish candle. The next day I wrote a post that Silver could reach higher highs, and long positions are favorable from the risk/reward point of view. The metal rocketed more than $1 from the posted price ($15.229), but caught the “bullet” in the sky and fell “dead”.
Below is the reconstruction of my chart from that post to see where the metal reached and what levels were broken back.
Silver Daily: After Crash

Chart courtesy of tradingview.com
Silver has managed to overshoot the distance of the green ab segment by 0.382 (at 1.382 Fibonacci expansion ratio) and has outweighed Gold’s progress that it couldn’t overshoot. The entire segment has fit into a single month of October from the trough to the peak on October 28th. Gold peaked earlier on October 15th and didn’t make new highs after that.
The reversal started the same day when Silver reached its maximum at $16.36. The price quickly fell below both the round number and the August high ($15.66) and closed at $15.91, almost half a dollar lower than the peak. If it closes below the September high at $15.43, we will see more weakness to come. One can still lock in some profit by covering the long side above the post reference price at $15.229.
But, "who shot the sheriff?" Was it leading Gold? No, as Gold fell two weeks before Silver did. It was the slow Fed who did it! It is still waiting to increase interest rates. Silver happened to drop the same day the Fed postponed the rate hike.
So let’s look at the chart below to find where Silver could fall.
Silver Weekly: Experimental Clone Chart

Chart courtesy of tradingview.com
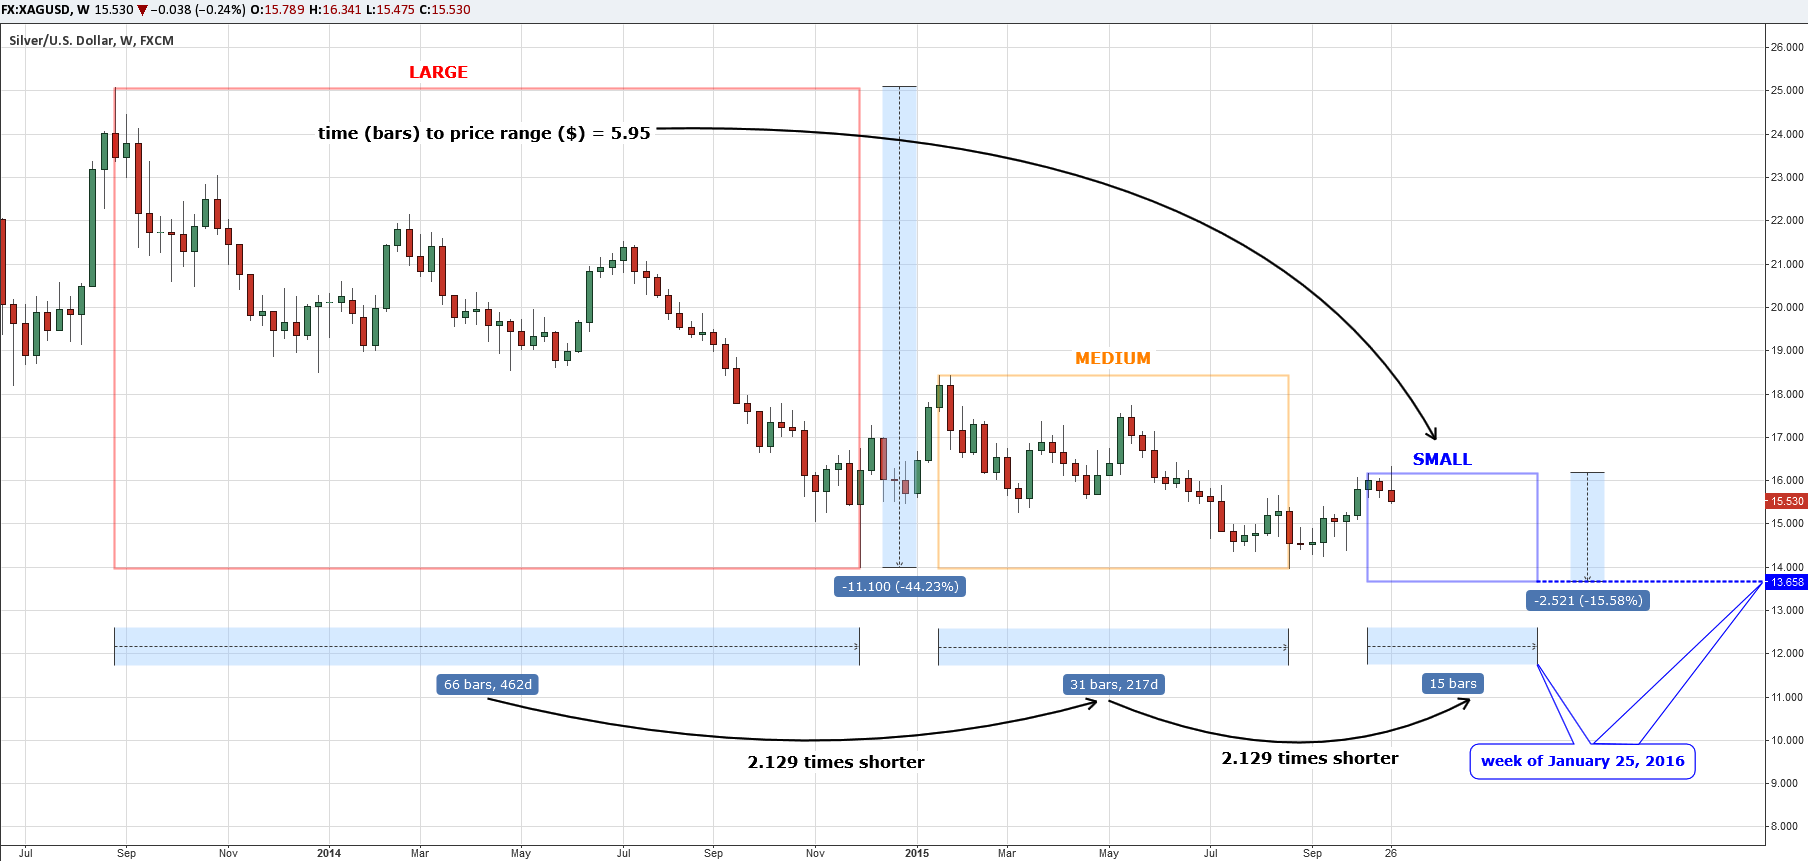
The chart above was built by an experimental model of clones. If you look abstractly, ignoring my remarks, you can see two distinct visible areas of price action where the smaller area (highlighted in orange) looks like a clone of the large area (highlighted in red). It is very useful to watch a clean chart for a while, and your eye can then detect some interesting visible similarities or other visual orders on it.
Now for a few touches to finish the painting, several measurements and calculations are required. The time span is the first measurement, under each period I put the period of time from high to low at the end. The large period lasted for 66 bars (weeks), the medium – 31 bars, 2.129 times shorter. Then I divided 31 to 2.129 and got 15 bars to be extrapolated for the current period started on the week of October 12th, and the outcome is the week of January 25th, 2016.
To find the price target, I divided the period range (66 bars) into the price range ($11.1) of the original (large) period. Then I divided the small period (15 bars) into the ratio of the large period (5.95 bars/$), and the result is $2.52. Now to get the price target we should subtract it from the first candle high of $16.18 which equals to $13.66, and it will be the new low in Silver. It is interesting that this target coincides with that calculated by segment concept in my September post.
Intelligent trades!
Aibek Burabayev
INO.com Contributor, Metals
Disclosure: This contributor has no positions in any stocks mentioned in this article. This article is the opinion of the contributor themselves. The above is a matter of opinion provided for general information purposes only and is not intended as investment advice. This contributor is not receiving compensation (other than from INO.com) for their opinion.


Who shot the sheriff? The same people who have been shooting him for decades, the Fed and the bullion banks.
http://investmentresearchdynamics.com/blatant-goldsilver-manipulation-reflects-the-complete-corruption-of-the-u-s-system/
Dear Steven, thank you for sharing!
Best, Aibek