

In my first post this year I will show you how metals have been moving the last 5 years and which levels you should watch in 2016 to be ready for actions. More illustrations, fewer words are ahead.
Metals Performance For The Past 5 Years

Diagram by Aibek Burabayev; data courtesy of tradingview.com
Out of the past 5 years the following two years are outstanding: in 2012 all metals were in green and showed from 6% to 9% positive dynamics, and last year was totally red with double-digit percentage negative dynamics.
2011, 2013 and 2014 were the years of “the last man left standing”: once it was Gold and twice it was Palladium that showed a positive performance. If you take a closer look, you will find that Gold is the best performer among this pack of losers with a cumulative loss of .25 during 2011-2015. Palladium ranked second with -30%, Platinum is third with -49% and the top loser is Silver, which has lost more than half with -55%. It is very interesting that Silver has fallen behind the industrial metals and lost too much to the Gold. Watch closely after the Gold/Silver ratio to see when the game will change as the top loser can outperform the leader.
Major Levels To Watch in 2016
Gold
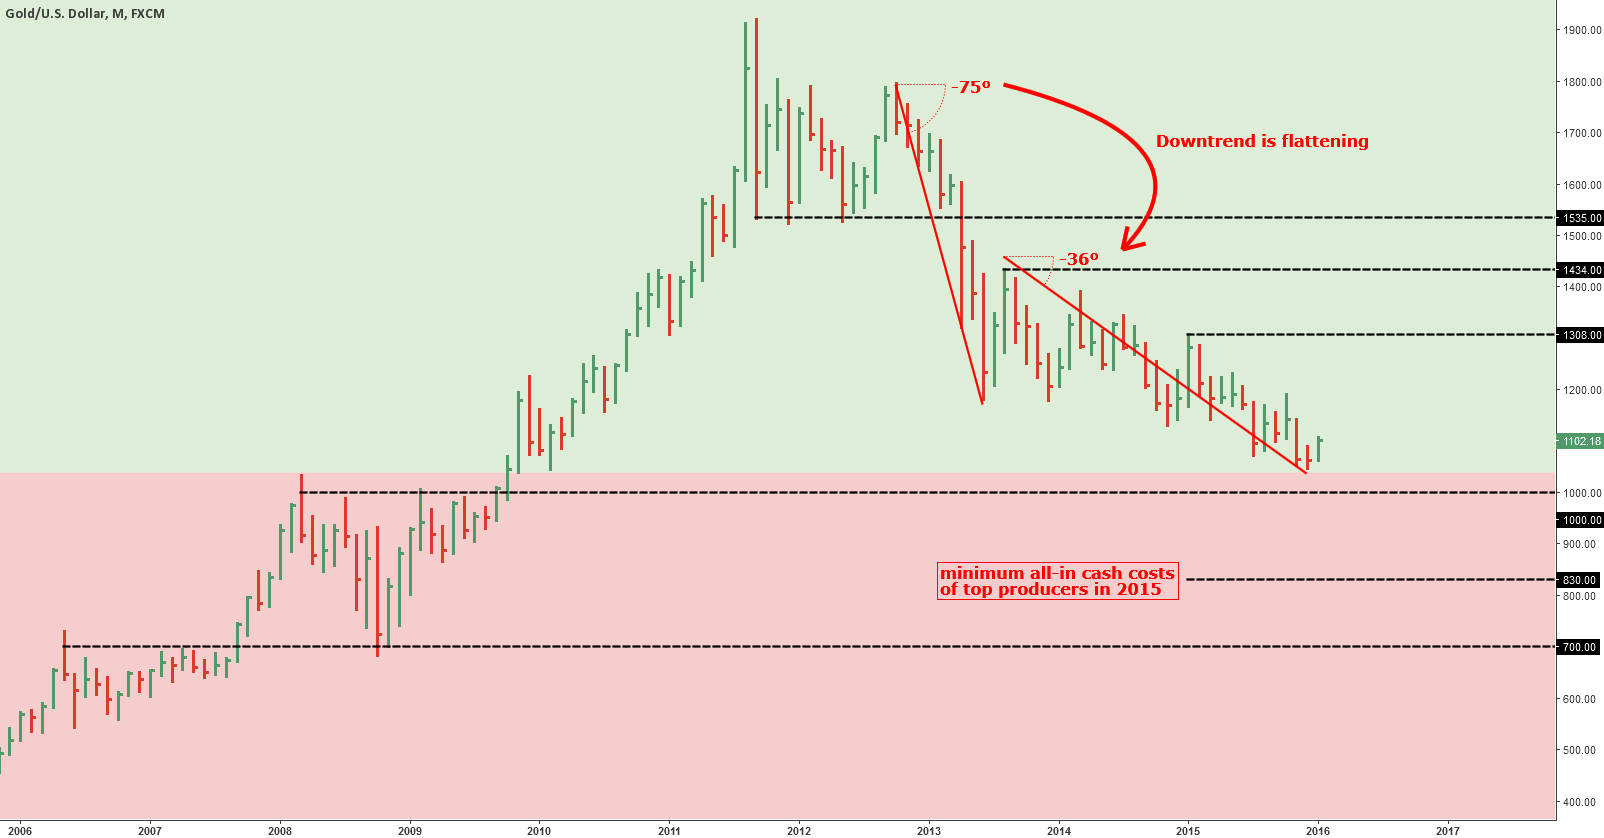
Chart courtesy of tradingview.com
Current trend: Down, weakening as angle is more than double flat
Major support 1: $1000 (strong psychological level, 2008-2009 consolidation area)
Major support 2: $830 (top Gold producers all-in cash costs area)
Major support 3: $700 (2006-2007 consolidation area)
Major resistance 1: $1308 (last year high)
Major resistance 2: $1434 (start of current mid-term downtrend)
Major resistance 3: $1535 (2011-2013 consolidation area)
Silver
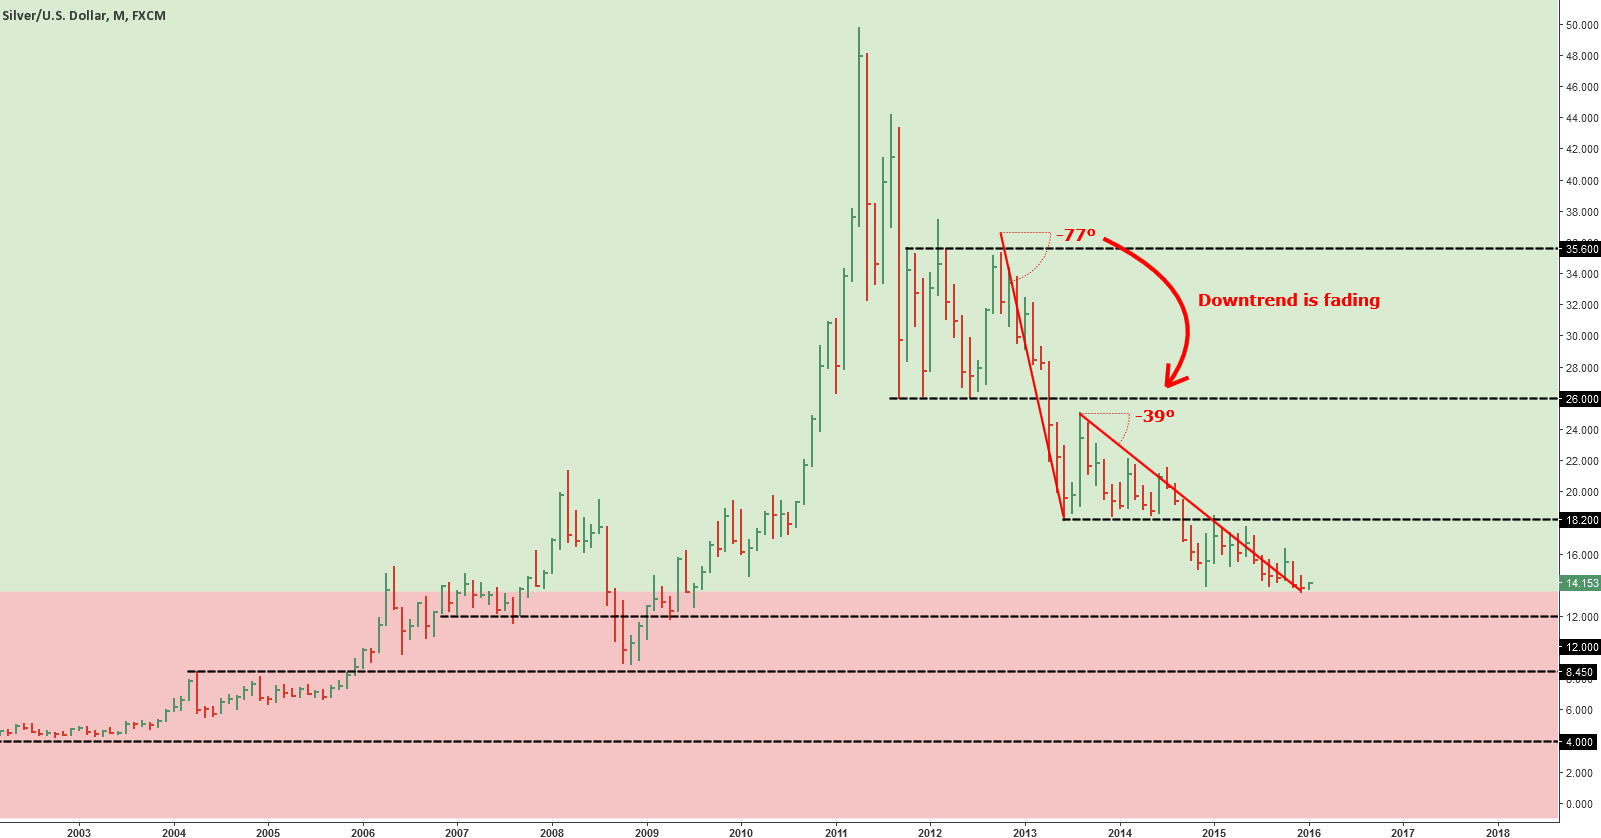
Chart courtesy of tradingview.com
Current trend: Down, fading as angle is almost double flat
Major support 1: $12.0 (2007 consolidation)
Major support 2: $8.5 (2004 consolidation, 2008 low area)
Major support 3: $4.0 (century low area)
Major resistance 1: $18.2 (previous consolidation area)
Major resistance 2: $26.0 (2011-2013 consolidation area - downside)
Major resistance 3: $35.6 (2011-2013 consolidation area - upside)
Platinum
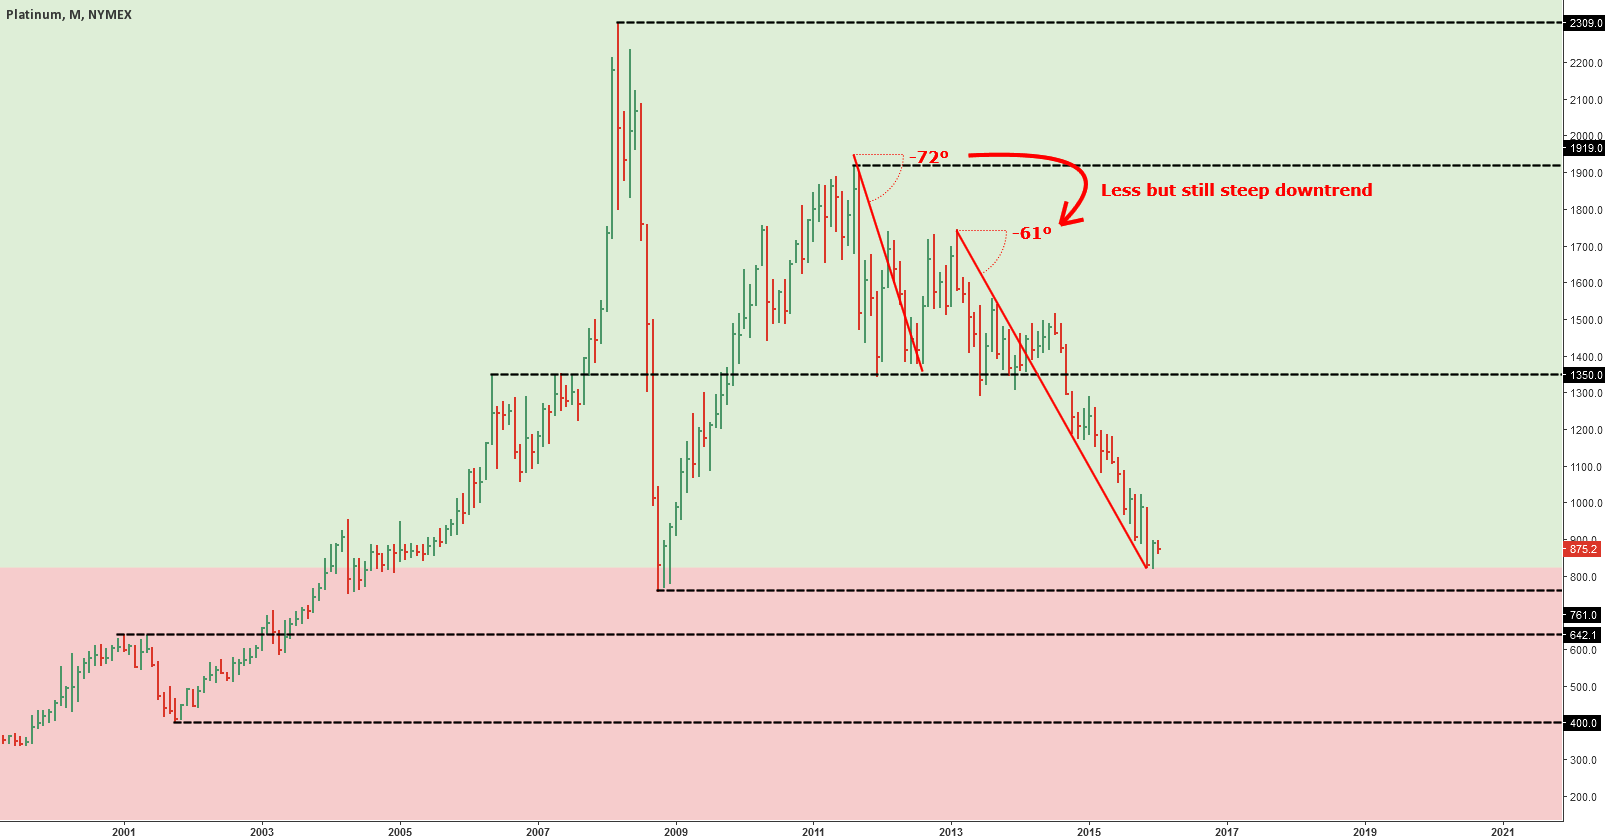
Chart courtesy of tradingview.com
Current trend: Steep down, strong with less sharp angle in place
Major support 1: $761 (2008 low area)
Major support 2: $642 (2001 high area)
Major support 3: $400 (2001 low area)
Major resistance 1: $1350 (2006 high, 2007 high, 2011 low, 2013 low area)
Major resistance 2: $1919 (2011 high)
Major resistance 3: $2309 (all-time high)
Palladium
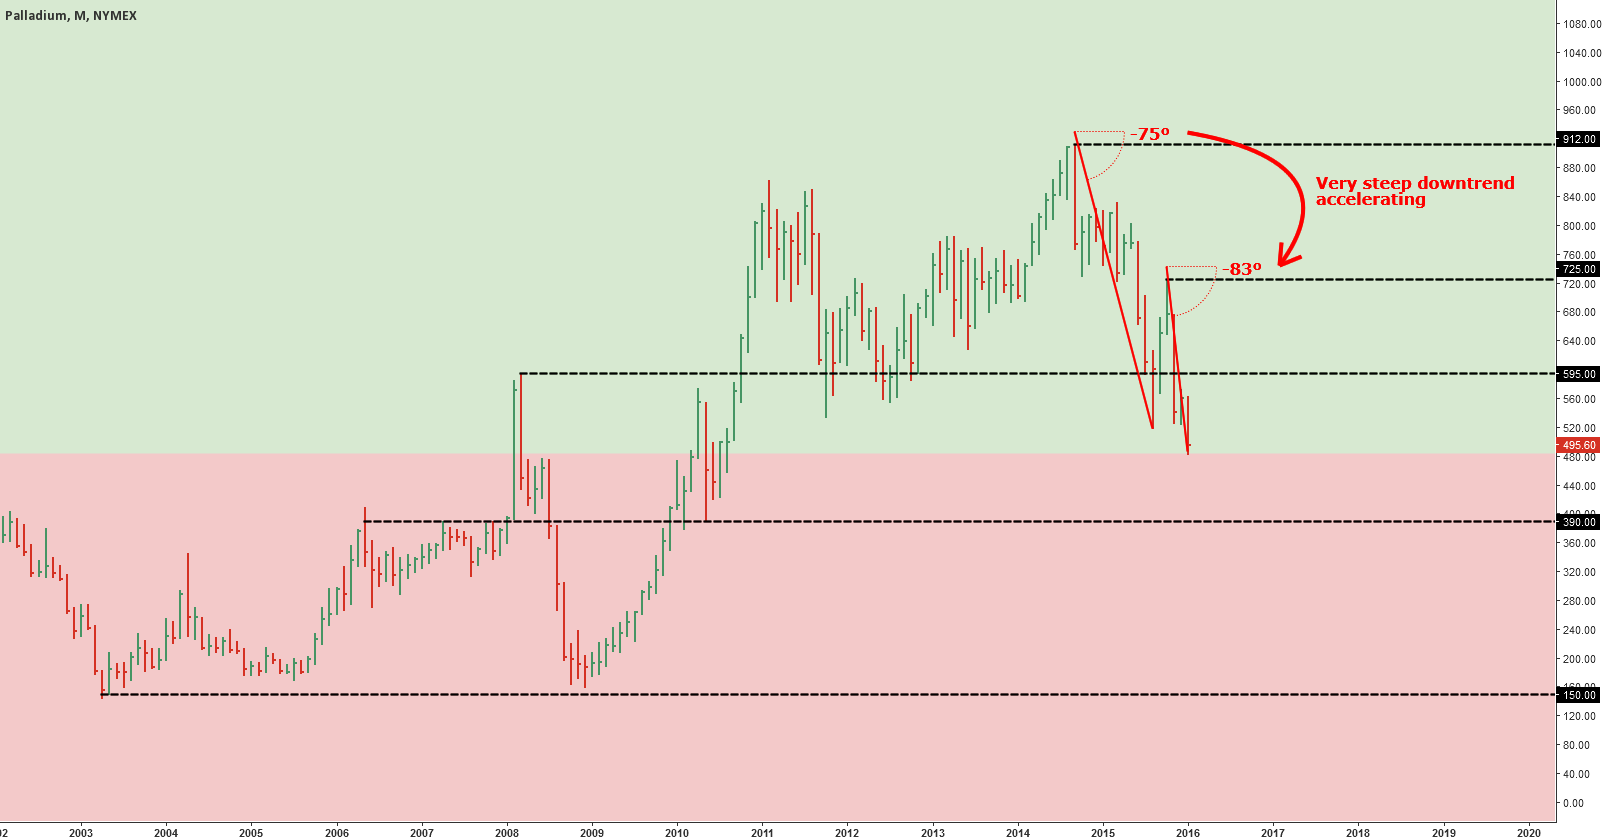
Chart courtesy of tradingview.com
Current trend: Very steep down, accelerating as sharper angle is in place
Major support 1: $390 (2006 high, 2007 high, 2010 low area)
Major support 2: $150 (2003 low, 2008 low area)
Major resistance 1: $595 (2008 high level)
Major resistance 2: $725 (last year high)
Major resistance 3: $912 (decade high)
Intelligent trades!
Aibek Burabayev
INO.com Contributor, Metals
Disclosure: This contributor has no positions in any stocks mentioned in this article. This article is the opinion of the contributor themselves. The above is a matter of opinion provided for general information purposes only and is not intended as investment advice. This contributor is not receiving compensation (other than from INO.com) for their opinion.
What are your views on copper, zinc, iron and aluminium?
Dear Anil, thank you for your question.
The metals from your list had been hit hard from the peaks in 2011.
They broke below 5 year lows and approaching 10 year lows (2007-2008 levels).
Iron ore is the top loser but others are also in the pack.
China's poor development is key here but the investors perception i.e. sentiment of the market is even more toxic (Fear has magnifying eyes). You might check my post at the following link https://www.ino.com/blog/2015/08/copper-points-at-weaker-economy/ - Copper moves with World GDP and it is true for the rest of the metals.
Best regards, Aibek