Precious Metals In 2016: The Dark Horse Won The Prize

Aibek Burabayev - INO.com Contributor - Metals


This interesting year is coming to an end and in this post I would like to offer you a summary of precious metals’ dynamics in 2016.

Chart 1. Metals in 2016: Boom And Bust

Precious Metals 2016
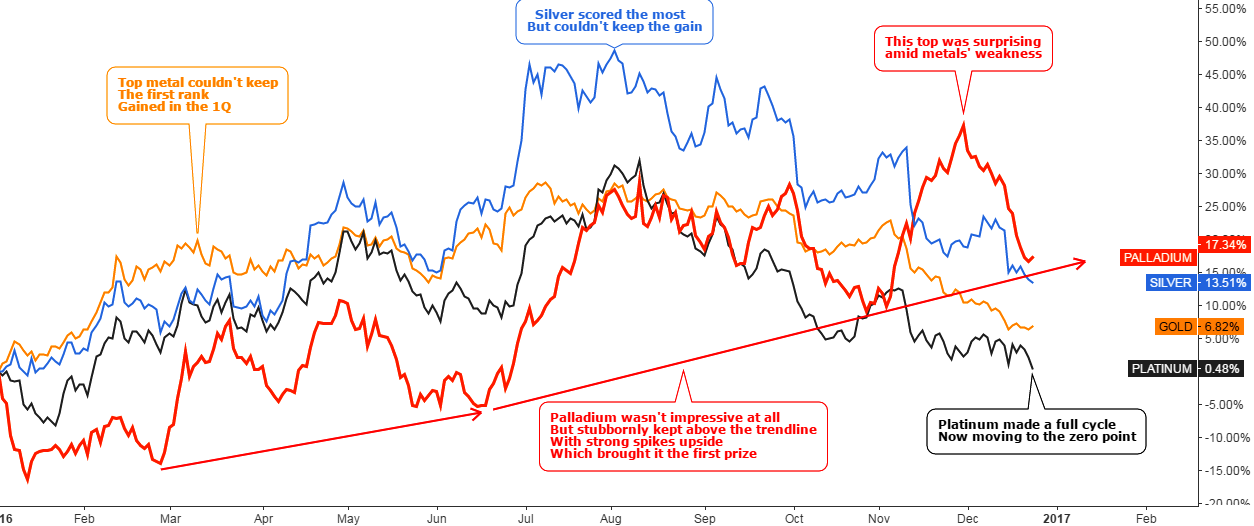
Chart courtesy of tradingview.com

This year metal trading was quite exciting. The chart shows that we have gone through a full Boom and Bust cycle and the top of the cycle amazingly coincides with the middle of a year, when metals showed a maximum gain (except Palladium) within the 25-50% range. Ideal distribution within a single year! Continue reading "Precious Metals In 2016: The Dark Horse Won The Prize"

Metals Illustrated: Past And Future

Aibek Burabayev - INO.com Contributor - Metals


In my first post this year I will show you how metals have been moving the last 5 years and which levels you should watch in 2016 to be ready for actions. More illustrations, fewer words are ahead.

Metals Performance For The Past 5 Years

Metals Performance For The Past 5 Years
Diagram by Aibek Burabayev; data courtesy of tradingview.com

Out of the past 5 years the following two years are outstanding: in 2012 all metals were in green and showed from 6% to 9% positive dynamics, and last year was totally red with double-digit percentage negative dynamics. Continue reading "Metals Illustrated: Past And Future"