

OPEC’s Monthly Oil Market Report (MOMR) for April featured an article on the summer petroleum products market. It observed that the U.S. is typically the key driver for products markets in the run-up to the summer driving season, and indicators are pointing to a positive and optimistic outlook.
It cites year-over-year January combined gasoline and diesel growth of 845,000 b/d. It states that the weekly data in February and March further supported this positive trend. And it concludes U.S. gasoline and distillates demand will grow by around a combined 992,000 b/d in 2018.
But a closer examination of gasoline demand and consumption estimates provide a different picture. Also, the MOMR totally ignored the supply side of the market, and last summer’s Hurricane Harvey and Mexico’s refinery problems contributed to support that is unlikely to be repeated this summer.
Demand
The MOMR only mentions data for three months (January through March), but a much longer timeframe is required to see the trends. Also, I use Vehicle Miles Travelled (VMT) to supplement the analysis of demand, which is derived from supply numbers and does not precisely represent end-user consumption; it is demand at the primary storage level.
Comparing 12-month moving average trends (to smooth out the noise in the data), the demand data is much more volatile than the VMT data. And the linear trend line of VMT is downward-sloping, with the latest (January) data showing a gain of 1.3%.
The average growth for VMT over this period (January 2015 to December 2017) was 2.0%, larger than the average demand gain of 1.5%. That is because MPG is rising, as older, less-efficient cars are replaced by newer, higher MPG vehicles.
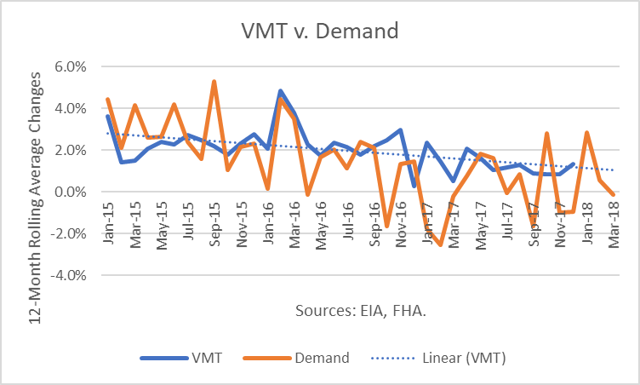
I estimate that the annualized growth in consumption is about 1.0% (off from the latest VMT annual rise of 1.3%). That would be about 95,000 b/d during the summer driving season (April – September, as defined by EIA). Higher gasoline prices may lower that figure.
Average Gain Percentage
- summer 2018 9641 95 1.0%
- summer 2017 9546 54 0.6%
- summer 2016 9492 144 1.5%
- summer 2015 9348 0 0.0%
- summer 2014 9348 318 3.5%
Production
Last summer, Hurricane Harvey pummeled Texas from August 17th through September 3rd, taking out a large number of Gulf Coast refineries. The impact was to reduce gasoline production by 1.1% in August and 2.6% in September, compared to their year-ago levels.
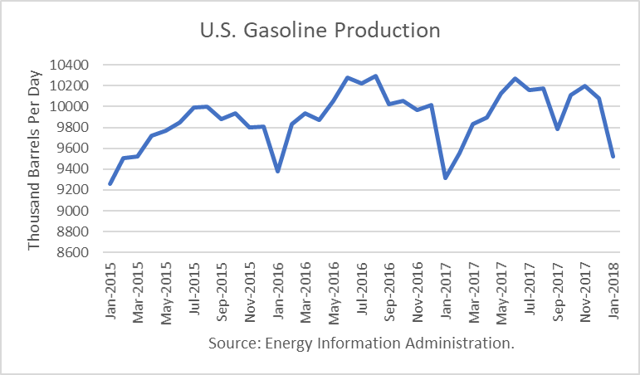
For the summer of 2018, I estimate that gas production will rise by about 2.0%, 200,000 b/d, from the summer of 2017.
Average Gain Percentage
- summer 2018 10270 201 2.0%
- summer 2017 10069 -57 1.0%
- summer 2016 10125 258 2.6%
- summer 2015 9867 130 1.3%
- summer 2014 9737 451 4.9%
Imports/Exports
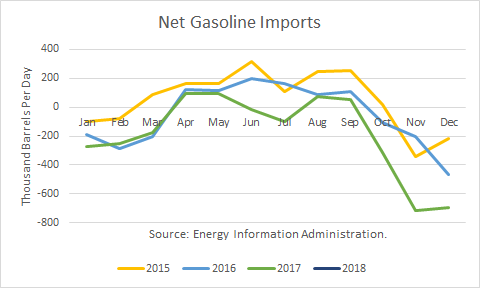
The U.S. is both an importer and exporter of gasoline. During the summer of 2017, and after that, exports to Mexico were raised to meet additional needs created by a loss of Mexico’s refinery capacity.
The Salina Cruz refinery, state of Oaxaca, went offline after a deadly fire June 14. The loss of the 330,000 barrel-a-day plant took the country’s refining production to the lowest level in decades and forced Mexico to ramp up fuel imports. The country’s refining production dropped to as low as 819,600 barrels a day in June. In 2017, Mexico’s state-run Petroleos Mexicanos’s refineries were operating at less than half of their crude processing capacity.
Pemex expects to increase crude processing at its refineries to some 900,000 barrels per day (bpd) by the second quarter, from January’s volume of slightly above 500,000 bpd. The firm also expected to finish the start-up of its smallest refinery, Ciudad Madero in northeastern Tamaulipas state, by the end of March. The work on Salina Cruz included the addition of a new pump house able to handle 451,000 barrels a day of crude for processing and 376,000 barrels for export.
It is difficult to estimate net imports of gasoline will be, but a conservative estimate is 100,000 b/d more than in the summer of 2017.
Average Gain
- summer 2018 135 100
- summer 2017 35 -97
- summer 2016 132 -57
- summer 2015 189 16
- summer 2014 173 -117
Conclusions
Last year, the U.S. gasoline draw over the summer gas season was about 20 million barrels. Using the numbers above, this summer could see a build of 17 million barrels. If such a build were to take place, it would certainly be a negative factor for oil prices.
Check back to see my next post!
Best,
Robert Boslego
INO.com Contributor - Energies
Disclosure: This contributor does not own any stocks mentioned in this article. This article is the opinion of the contributor themselves. The above is a matter of opinion provided for general information purposes only and is not intended as investment advice. This contributor is not receiving compensation (other than from INO.com) for their opinion.
The report says gas guzzlers being replaced by by cars that use less gas. The author definitely needs to go to any parking lot and see the astounding amount of larger vehicles. He's about 5 years behind.
Instead of all the above rhetoric, why not say that, "gas prices will be going up or down in the coming months."