
Gold and silver chart structures got synchronized, and I am happy to bring them back together in this post.
Chart 1. Gold Daily: $1557=>$1458
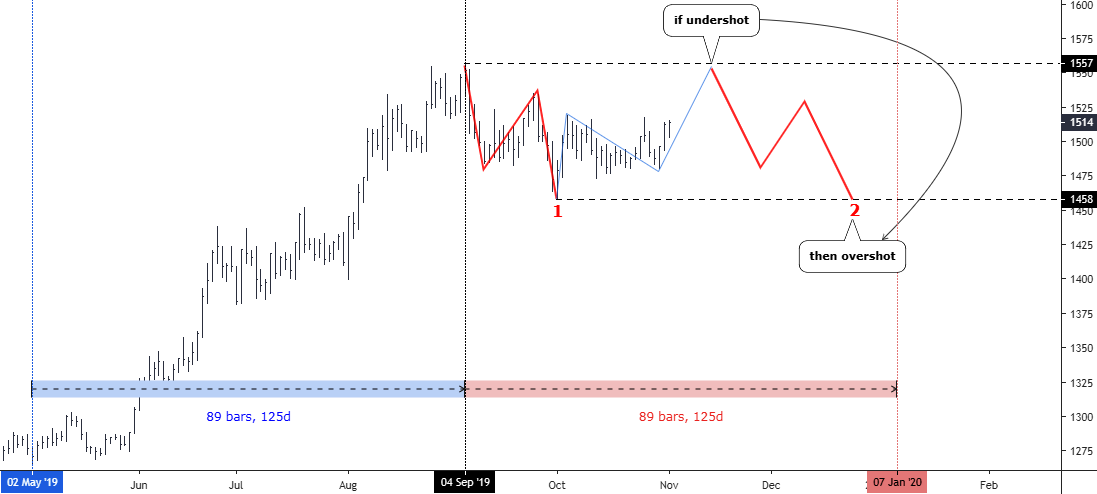
Chart courtesy of tradingview.com
In my earlier post, I shared with you a detailed 4-hour chart of gold with a bullish outlook. Fortunately, the price had indeed gone higher and booked $27 per each ounce since then. I set the confirmation above $1520, which wasn't triggered yet, although we were very close as a high was hit at $1518 at the end of October.
I think that setup is not valid anymore as there are signs of an extended consolidation appearing on the chart. I updated it for you above. The first alert came after the price couldn't overcome the $1520 barrier and quickly dropped back below $1500 to hit $1481. The second warning is the amount of time that elapsed since the end of the preceding correction (now marked as 1st red leg down). That drop took 19 bars (27 days) to unfold, to compare the current blue zigzag up is already 23 bars (31 days) long. This looks like an intermediate consolidation ahead of another leg down (marked as red 2).
So, be careful with your longs and adjust your trading plan if necessary as the price could fall out of the range. The last leg up of a blue zigzag could touch the upside of the current $1557-$1458 range, but then the other leg down could start and do it very fast to catch the bulls in euphoria. Watch this move up to see how much it will undershoot below the upside of the range as it will show you how much it will overshoot the downside of the range then. Simple math is working here as we assume that in classics the leg 2 will be equal to leg 1 down. The second leg's red zigzag down looks perfect and symmetric as I put it this way to map the move, but it could take different shapes, of course.
Talking about classic chart structure, which quite often has been built on the gold graphs, here is another one on the time scale. I measured the date range of the upside move (blue range) preceding current consolidation; it is 89 bars long (125 days). Then I added it to the start of the consolidation to find where it could finish; the end date falls on the 7th of January, 2020. It contradicts with the ending point of the perfect second red zigzag down, which falls on the Christmas day. Let's see which approach will play out at the end.
Chart 2. Silver Daily: Undershot=>Overshot
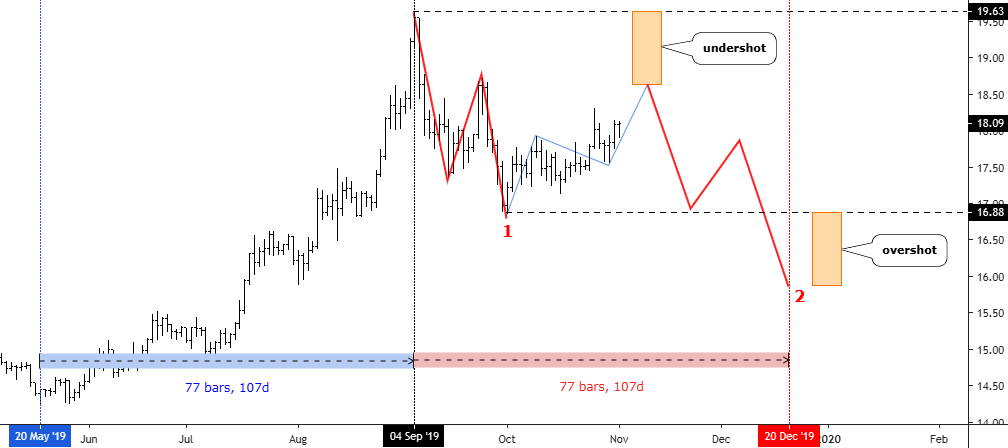
Chart courtesy of tradingview.com
This was the silver, which showed the path for both metals in September as it didn't reach the target of $21.13, although it advanced quite deep and fast to the upside. And this uncompleted mission to hit the target canceled the reversal model for the gold.
In this post, we are looking deep into the anatomy of the current consolidation for both metals, which is going to be extended. After it’s complete, we will adjust the price targets for both metals.
Silver always has a sharper chart structure than the gold has as central banks prefer the latter and it is a double-edged sword. Sometimes it is confusing, and only gold is a clear compass then. This time, on the contrary, it clearly shows that this consolidation gets more complicated as the sharp drop (red 1) was changed with a sideways move (blue zigzag). The same flags are here - not triggered confirmation above $18.74 and the delayed move up.
It is clear that the most probable current move up will undershoot the upside of the range at $19.63. This assumption is based on the length of the first leg up. It means that the second leg down could overshoot deep under the bottom of the range at $16.88. It could hit below $16. It shouldn't surprise silver traders as it is a normal behavior of it.
Let's check the date ranges of silver as we did for gold before. The move-up took 77 bars (107 days) to unfold, and it is a way shorter period, compared to gold, but we should bear in mind that the silver was catching up with already successful gold. I added this period to the start of consolidation; the ending point falls on the 20th of December, 2019. This time the perfect zigzag and the date range approach hit the same date.
It looks like "whales" prepare the precious metals for a Santa Claus Rally as gold's 2nd drop and silver's both measurements fall around the Christmas day.
Intelligent trades!
Aibek Burabayev
INO.com Contributor, Metals
Disclosure: This contributor has no positions in any stocks mentioned in this article. This article is the opinion of the contributor themselves. The above is a matter of opinion provided for general information purposes only and is not intended as investment advice. This contributor is not receiving compensation (other than from INO.com) for their opinion.
Dear Aibek,
As you may well aware that since 2011, I am bearish for Gold, and between 2011 to 2019, in my repeated posts published in INO Platform, I preferred to predict overall Mid-Long Term downtrend.
However, considering some last 12 to 18 month's movement, I think I should change my views accordingly. At this stage, neither I predict down trend nor up trend because during such period there is side way movement between $ 1250 to $ 1550 registered.
Actually earlier I have predicted such probability of such side way movement, and this may be extended for the next couple of years, with a pre-conditions that there must not be occurrence of any sensitive incident like War or other alike situation. Second other most concerned issue is sudden and sharp fluctuation in Global Currencies, which will have major effects on Gold counter.
As Mr. Ron said above,"commercial traders ( supposedly the "smart money") still hold a big short position on both metals according to the latest COT" but there is enough probabilities that such so called Smart Traders may caught in a Bear Trap, followed with unexpected sharp and faster Jump. History Tells that "Smart Money" not proven so Smart for every time.
Finally, this is a juncture, when and where both Bulls and Bears required to be extremely cautious and must follow Stop-Loss levels very strictly. As per my view, Time frame up-to March 2020 indicates heavy volatility with an either side probabilities.
I think that gold will go down during the melt-up,and start going higher when the end is near,good warning sign to get out and consolidate your coin
Dear Thedude,
Thank you for sharing!
Aibek,
Another ominous sign is that the commercial traders ( supposedly the "smart money") still hold a big short position on both metals according to the latest COT. During the last runup they had started to lighten up on their short positions right when the runup started.
Dear Ron,
Thank you for sharing!
Aibek,
Always look forward and respect your insight. We are lucky to have your regular contributions to help us with our positions. Funny, over the weekend I determined that I did not like the chart of CDE, a silver miner, so sold this a.m. Your insight gives all of us the target area to repurchase.
Thanks.
Dear Al,
Thank you so much for a warm feedback. I am happy to share my thoughts here on the Blog.
Lucky trades! Aibek