
On the 16th of March, when I wondered if “That’s It?” for gold it dropped for more than $100 to the low of $1451. It looked like the first move down in the large second leg of a huge complex correction.
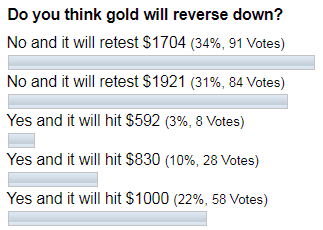
As we know, guessing tops and bottoms is a tricky exercise. So, the next move up was considered to be a correction as to confirm the top we should see the passing move down first (checked), then there should be a corrective move in the opposite (upside) direction and the next should be the continuation to the downside. Let’s see below if you thought gold would reverse down.
The majority of you remained bullish as you clicked on the “retest of $1704” and “$1921”. The first bet already paid well as the market retested the former top last Monday. This price move was quite sharp as previously the same distance unfolded by gold within only 82 daily bars from November 2019 till March 2020 compared to only 20 daily bars this time.
It looks like gold doesn’t want to drop as things changed dramatically. The infected world has been trapped with isolation, border closures and disruption of global supply chains. The first prey, China, saw its economy drop for shocking -6.8% in the 1Q of 2020. Dr. Copper and crude oil already indicated the drying demand all over the world as the global economy got hurt.
Monetary authorities pledged to print the money to save the economy as they did in 2008. But this time the size is much bigger than ever before as QE4 could throw trillions of helicopter money in open-ended mode. During the Great Recession the price of gold almost tripled from under $700 beyond $1900. The current complex situation of world economy wounded by trade wars, COVID-19 pandemic, OPEC failure and etc. wasn’t nicknamed as yet, but it will be “The Great” or “The Greatest” thing for sure. This will change the game for gold as we saw it for silver already.
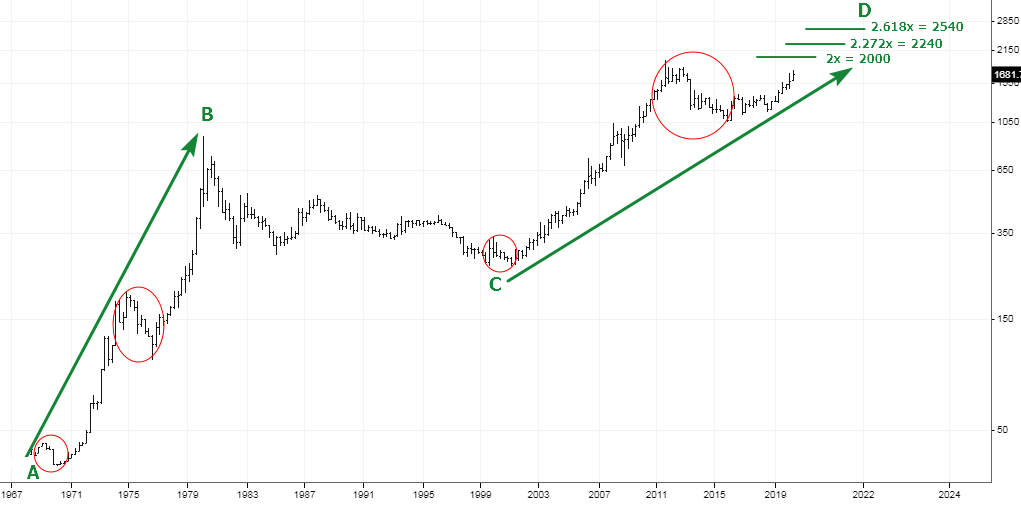
Chart courtesy of stooq.com
It’s time to reconsider the gold chart structure and we start with the quarterly gold chart above. I turned it to log scale to show the internal structure of the first move (green AB segment) up from late ‘60-s in the details. The other reason is to have a visual comparison of AB and CD segments. Let me list the findings for you.
The AB segment consists of three passing moves to the upside, with two consolidation areas in between highlighted with red ellipses. Interestingly, we have the same two corrective structures within the current CD segment and the third passing move up is pending then.
As we are on the log scale, the size doesn’t represent actual distances as it shows relative parameters. That is why it looks like the CD segment is almost equal to the AB segment, but it almost hit the double distance of the latter in 2011. I put the set of Fibonacci ratios to highlight the possible target area. The 2x ratio (double) is equal to the $2000; the next is the 2.272x at $2240 and the last one is 2.618x at $2540.
Now let’s look at the classic monthly chart below for further clues.
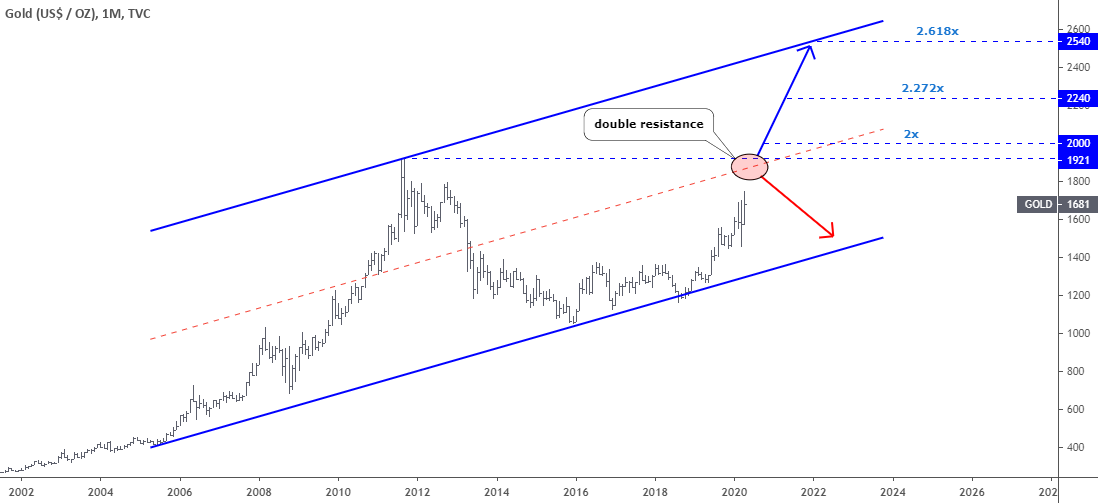
Chart courtesy of tradingview.com
I built the huge uptrend channel (blue) on the monthly chart above through the valleys of 2005 and 2015 on the downside and the peak of 2011 on the upside. The set of targets from the quarterly chart above was added here. The highest target of the three sits right on the upside of the channel. Other targets are inside of the channel in the higher part of it above the mid-channel. It is a promising sign as two different approaches match each other.
There is a tough double resistance in the $1870-1921 area where mid-channel crosses the former all-time high. The price should overcome it before it could hit any preset target. If it fails there, we could get back to the complex correction idea that was posted earlier.
Please kindly share your forecasts and comments with all of us here on the Blog.
Good luck!
Aibek Burabayev
INO.com Contributor, Metals
Disclosure: This contributor has no positions in any stocks mentioned in this article. This article is the opinion of the contributor themselves. The above is a matter of opinion provided for general information purposes only and is not intended as investment advice. This contributor is not receiving compensation (other than from INO.com) for their opinion.
It's Time for the XAU to take the trip up to 3000. It will be a wild ride.
Gold will follow the course of lease resistance. Right now the only investment with out liability is gold.The climate is the fuel for it. If we have the clouds part and sun comes out the price of gold will fall hard and fast. I believe in not making predictions and watching for the movement in your charts. " The market holds no prisoners."