
If you've hung around my articles long enough, you know that when I take a look at what assets to devote my hard-earned cash to, I've found that both technical and fundamental analysis are two great tools. They've served me well over the years.
In fact, earlier this year I did a deep dive into why both technical and fundamental analysis is the dynamic duo of investing. And I didn't pull any punches about the merits of using both these tools. Here's what I said:
Through my experience as a stockbroker, accountant, and financial analyst, I can tell you that the best investors I've run across usually deploy a mixture of fundamental and technical analysis when they go around looking for investments. They want to know what an asset does and how it makes money. But they also want to know what's happening to its price.
Today, I'm going to revisit the first of these tools, technical analysis, and apply two of my favorite tools in that toolbox to Bitcoin (BTC). Why? Because when I fired up my computers and screeners this morning, my technical signals were going off the charts.
So, let's get to it!
RSI Says BTC Will Take Off
When I did my deep dive earlier this year into technical and fundamental analysis, one of my favorite indicators in the former's toolbox was the RSI. RSI stands for Relative Strength Index. The RSI is a momentum oscillator that tells us how much an asset's price changes and how rapidly those changes occur.
Here's how it works: When the indicator reaches the lower bound of 30 on the RSI, the asset is in an "oversold" state and may be headed higher. On the other hand, when the indicator reaches the higher bound of 70 on the RSI, the asset is in an "overbought" state and may be headed lower.
The nice thing about the RSI is it's intuitive. Why? Because after an asset goes through a period of selling, and becomes oversold near the lower bound of 30 on the RSI, those lower prices are likely to attract buyers. The opposite is true when an asset goes through a period of buying and becomes overbought near the upper bound of 70. Those higher prices are likely to attract sellers.
In January, I made the case that when BTC got near the lower bound on the RSI, it usually headed higher. And so far this year, that's played out to plan. See for yourself:
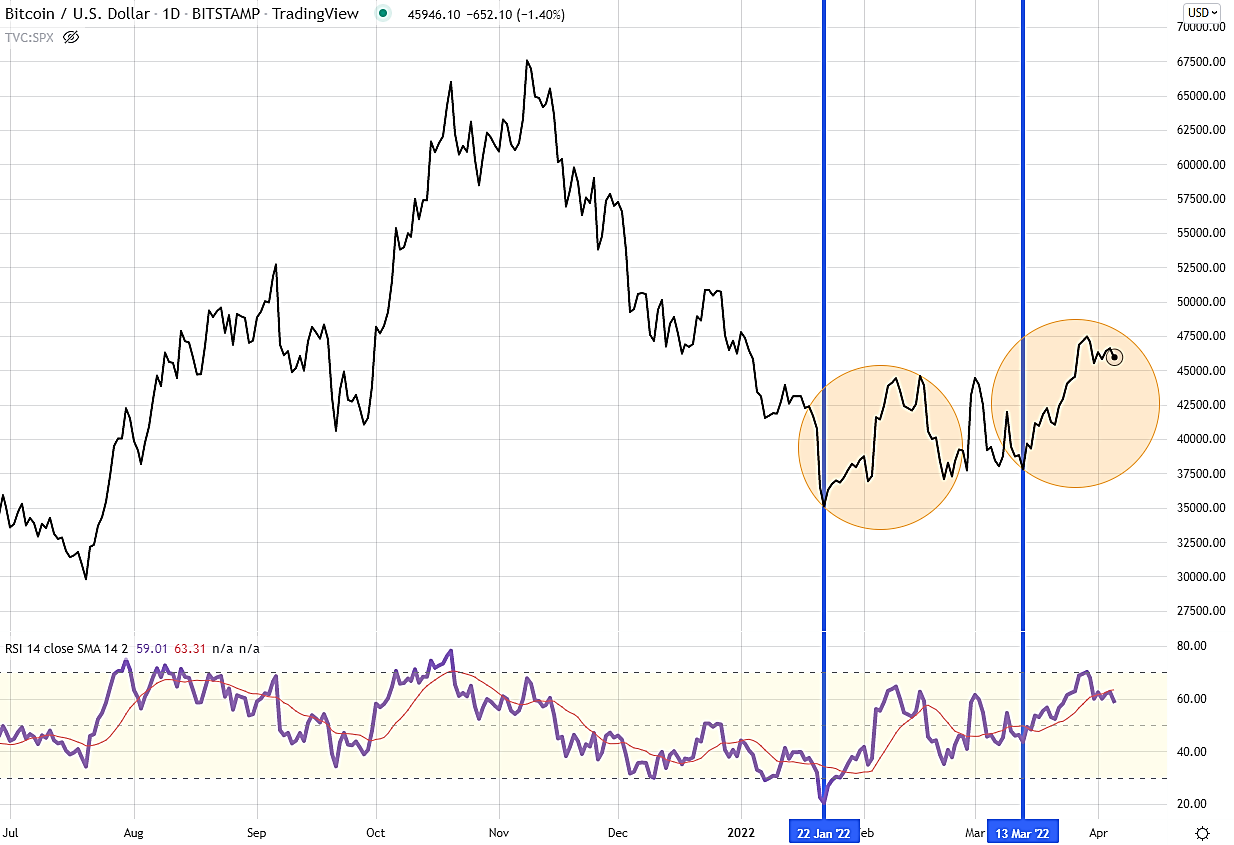
As you can see from this chart, when BTC got near or below 30 on the lower bound RSI, it took off. In fact, when BTC triggered that RSI level in January, it was trading at $35,030. It then proceeded to climb to $44,339, a 27% gain. That's bullish action if you ask me.
But that's not all. When BTC triggered a similar RSI level in March, it traded at $37,850. It then proceeded to climb to $47,466, another 25% gain. The interesting feature of this move is that the RSI was triggered at a higher level. And that tells me that buyers grew tired of driving BTC lower more quickly in March than they did in January. That tells me that there is less appetite for lower prices, another clear sign of a strong market in BTC.
Support And Resistance Are Bullish For BTC
While RSI has worked out nicely for us when looking at BTC, it's not the only technical indicator that has been lighting up my computers lately. The other? It's the old standby of support and resistance. And like RSI, it says that BTC is likely headed higher. Let's look at the same BTC chart but with support and resistance indicators:
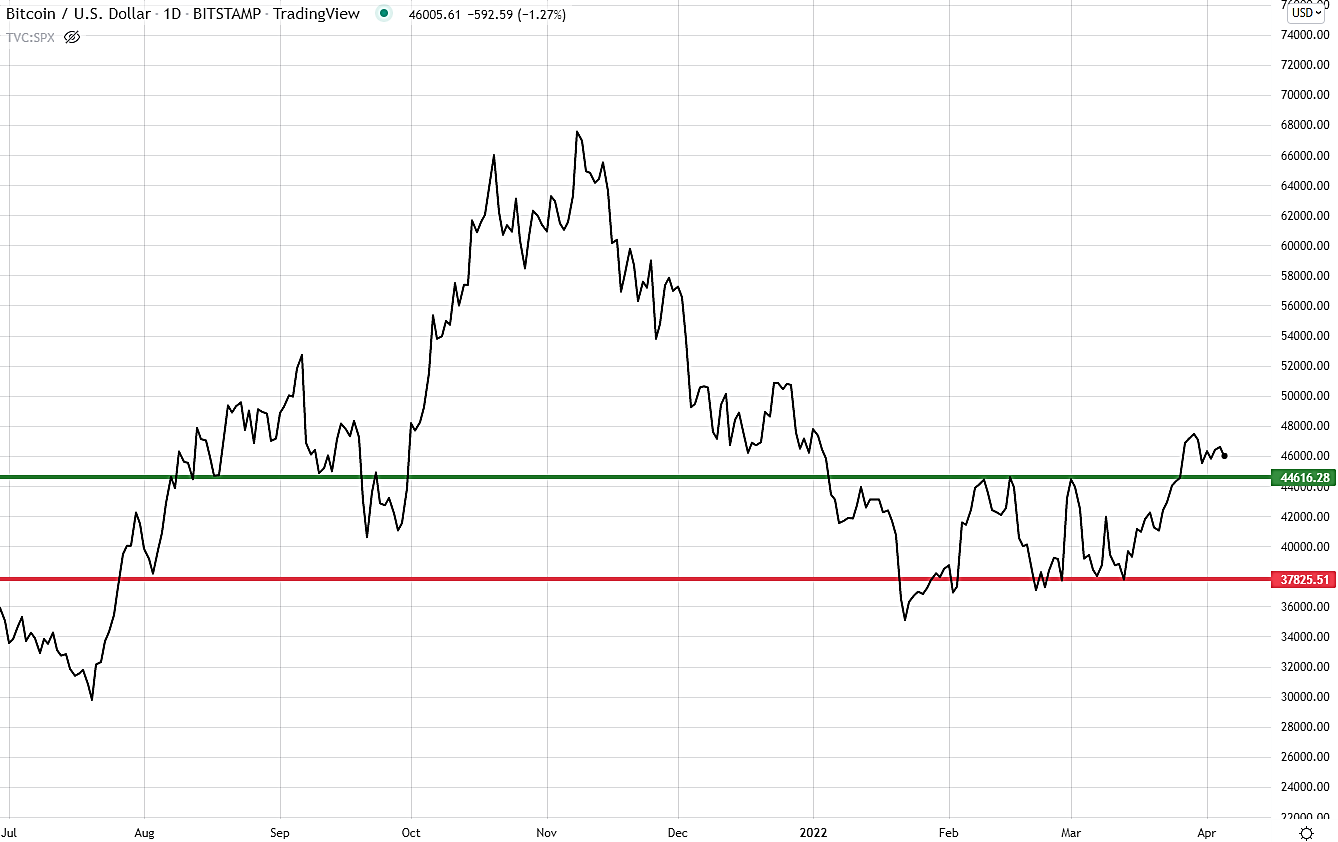
The green line on this Bitcoin chart is a resistance level. On this chart, that resistance level is $44,616. What does that mean? It means that in the recent past, when BTC got to this level, buyers lost their appetites and began selling. As you can see from this chart, BTC got to this resistance level two times in February and once in March. All three times, it failed to pierce that level, turned around, and went lower.
On the other hand, the red line on this BTC chart is a support level. On this chart, that support level is $37,826. And opposite of resistance, a support level means that in the recent past, when BTC got to this level, sellers grew their appetites and began buying. But unlike BTC's clearly defined resistance levels, BTC support levels are murkier. On this chart, I've placed them at $37,826. But you can see that you could move that support around a bit and still defend a justifiable support level.
Ok, so what can we conclude from these resistance and support levels? The answer is pretty intuitive: When BTC gets close to its support level, it would be a good time to consider buying. On the other hand, when it gets near its resistance level, it would be a good time to consider selling or holding.
But what does it mean when BTC pierces a resistance level like it did in late March? That's a bullish sign that buyers have increased their appetite for higher prices and are willing to pay up to buy BTC. No doubt about it, that's another bullish sign.
But there's more to that, too. Once BTC pierced its resistance level at $44,616, that level has created the potential of becoming a new support level. But it would have to test that level and succeed.
That test is pretty straightforward: If it gets to $44,616 and stays above it or trades sideways, it passes the test, and the level could be a new support level. But if it gets to it and continues through it to lower levels, it fails the test, and the level reverts to its prior status as a resistance level. To find out, we just have to wait and see.
Wayne Burritt
INO.com Contributor
Disclosure: This contributor may own cryptocurrencies mentioned in this article. This article is the opinion of the contributor themselves. The above is a matter of opinion provided for general information purposes only and is not intended as investment advice. This contributor is not receiving compensation (other than from INO.com) for their opinion.
Hello Wayne, thank you throughout everything around the world and have trust me, thank you again.