
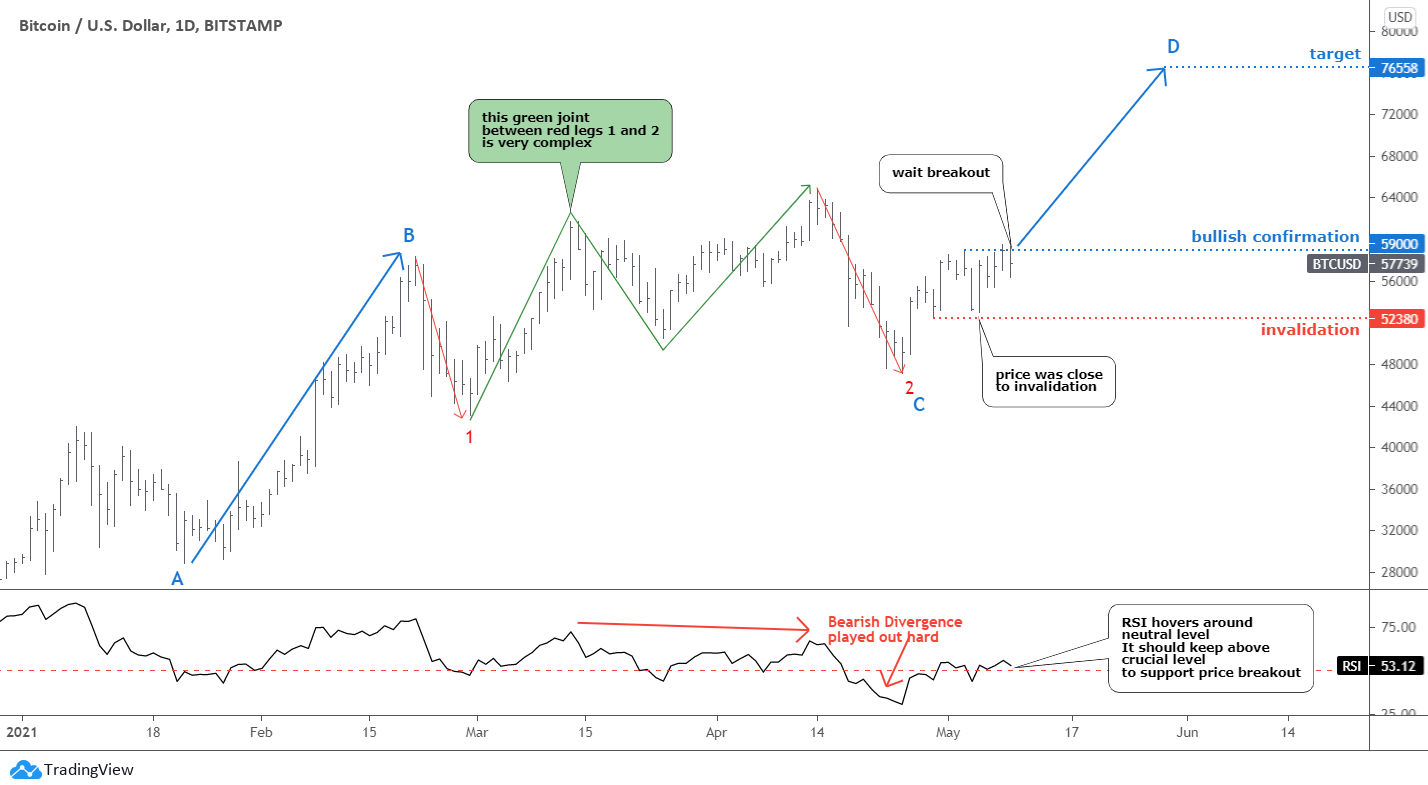
The bullish setup for Bitcoin that I discussed last week was not triggered, as the price did not break above the bullish confirmation level. The price went the opposite direction, falling beneath the invalidation trigger instead.
The key factors for the sell-off were the U.S. probe into the Binance crypto-exchange, and Tesla is reversing its stance on accepting Bitcoin. The green economy does not support Bitcoin due to its vast electricity consumption, which is generated primarily from fossil fuels.
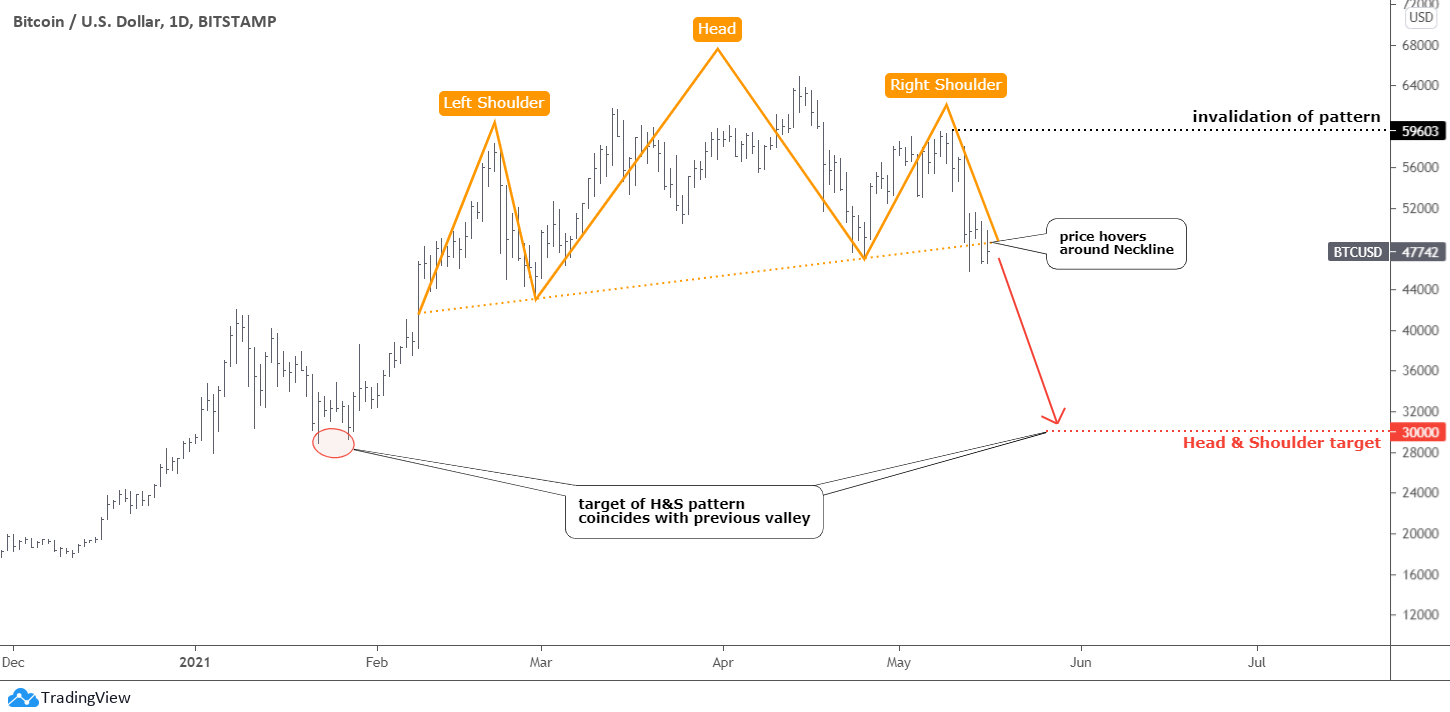
The combination of peaks in one area with the highest one in between has built the famous Head & Shoulders reversal pattern (orange). The main focus now is on the orange dotted Neckline as the price hovers around that support. A clear breakdown of it is needed for the pattern to play out.
The pattern's target is located at the height of the Head, subtracted from the Neckline at $30k. There is a previous valley located in the same price area. This could be a substantial drop of 37% from the current price level.
The invalidation trigger of the pattern is located at the top of the Right Shoulder at $59,603 (black dotted line).
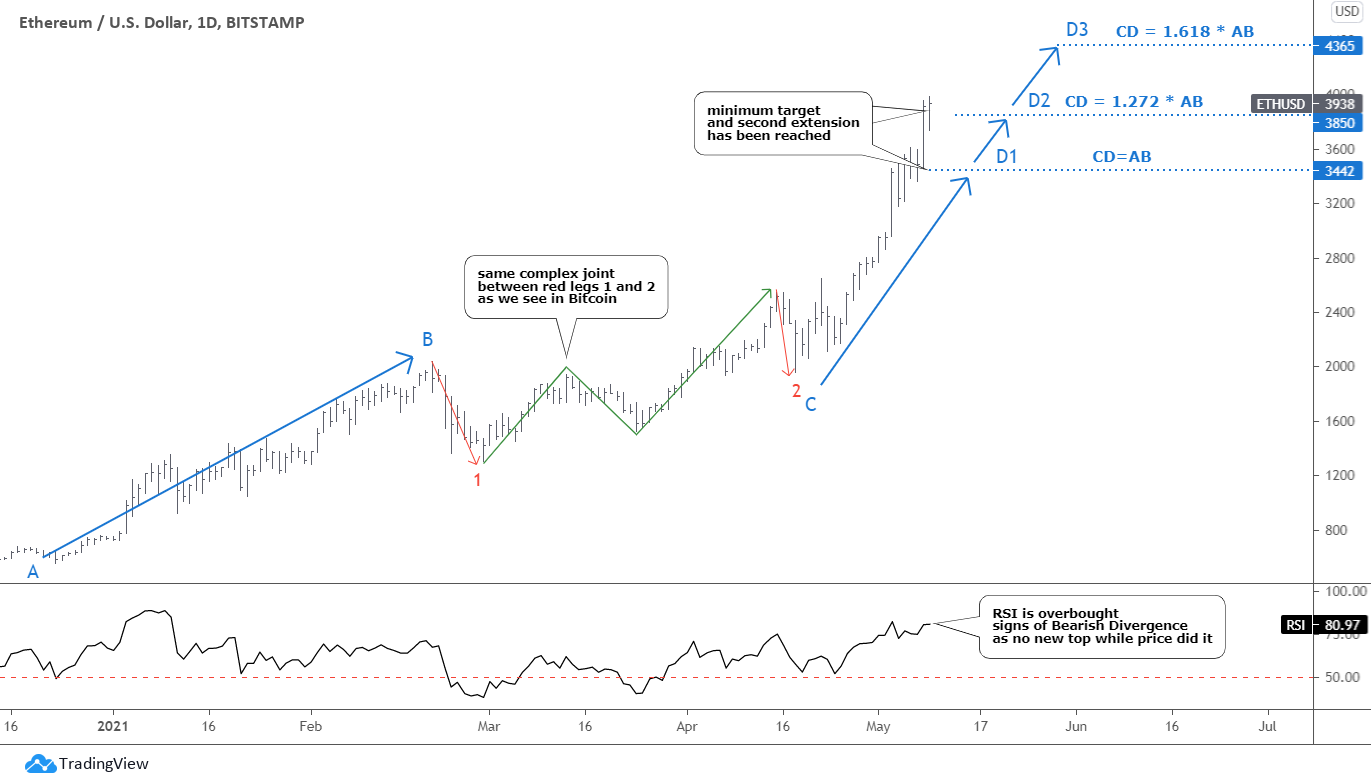
Ethereum has also suffered from the recent sell-off of Bitcoin, but before that, it was able to hit all three preset targets. The last target was reached on May 12 when the price established a new all-time high at $4,381. It was three days after the post about Ethereum was published.
Call it a miracle, but the price reversed right around the 1.618 extension ratio in the CD segment (marked as D3 target). The RSI also warned us about the overbought conditions in the market. However, there was no Bearish Divergence detected.
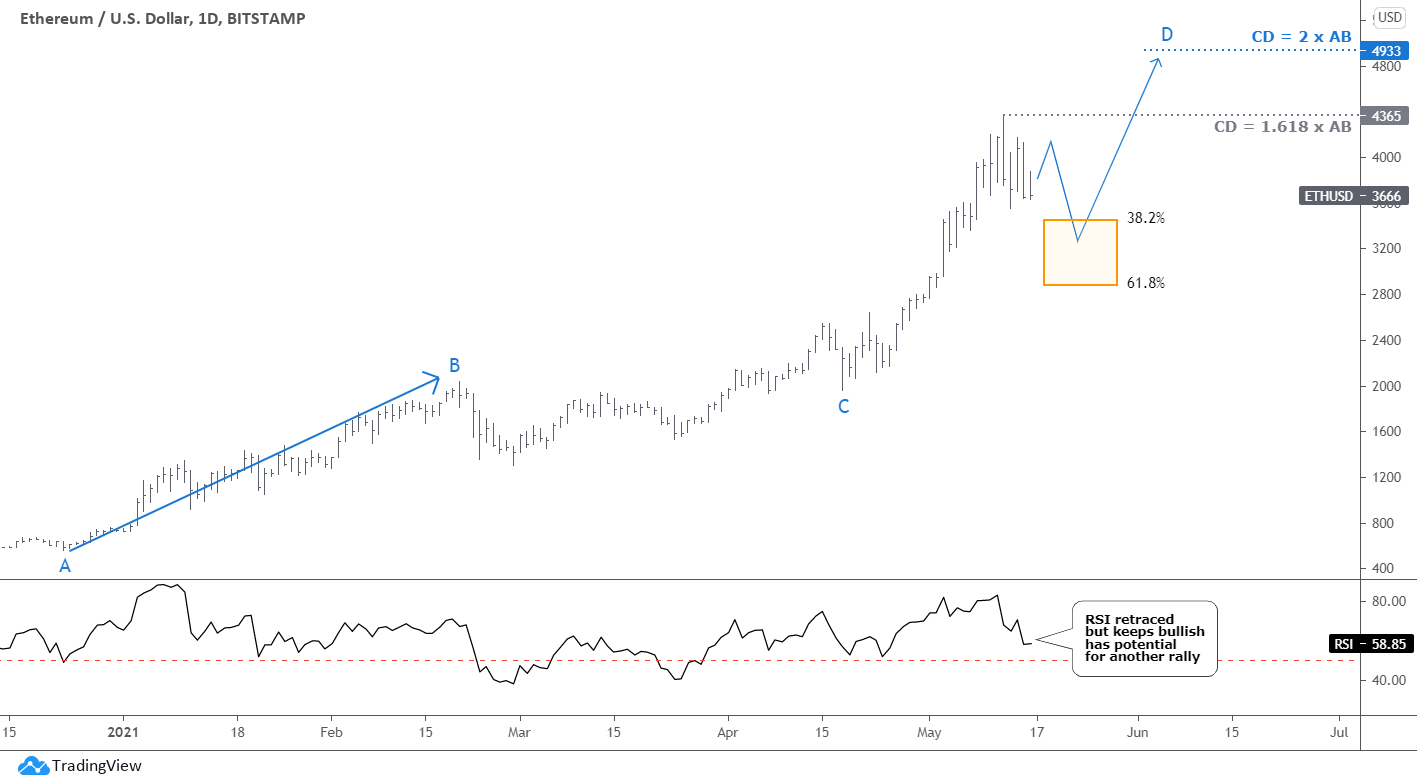
The indicator has been retracing with the price to the downside. At the same time, it stays bullish so far, and we could consider this a natural correction in the market, as it should take a rest after hitting all three targets in a row.
I applied the 38.2%-61.8% Fibonacci retracement levels to build the orange rectangle to highlight the potential target of the current correction. The upper side of it starts at $3,453, and the bottom is located at $2880. The 50% retracement is at $3,166. Let us see how deep it will go. The RSI still has some room to the downside before it will touch the crucial 50 level.
The next bullish target is located at the double distance of the A.B. part at $4,933. The minimum target to the upside is to retest the all-time high of $4,381.
The third-largest coin by market cap is Ripple (XRP). I added it to my review as I spotted a famous pattern there.
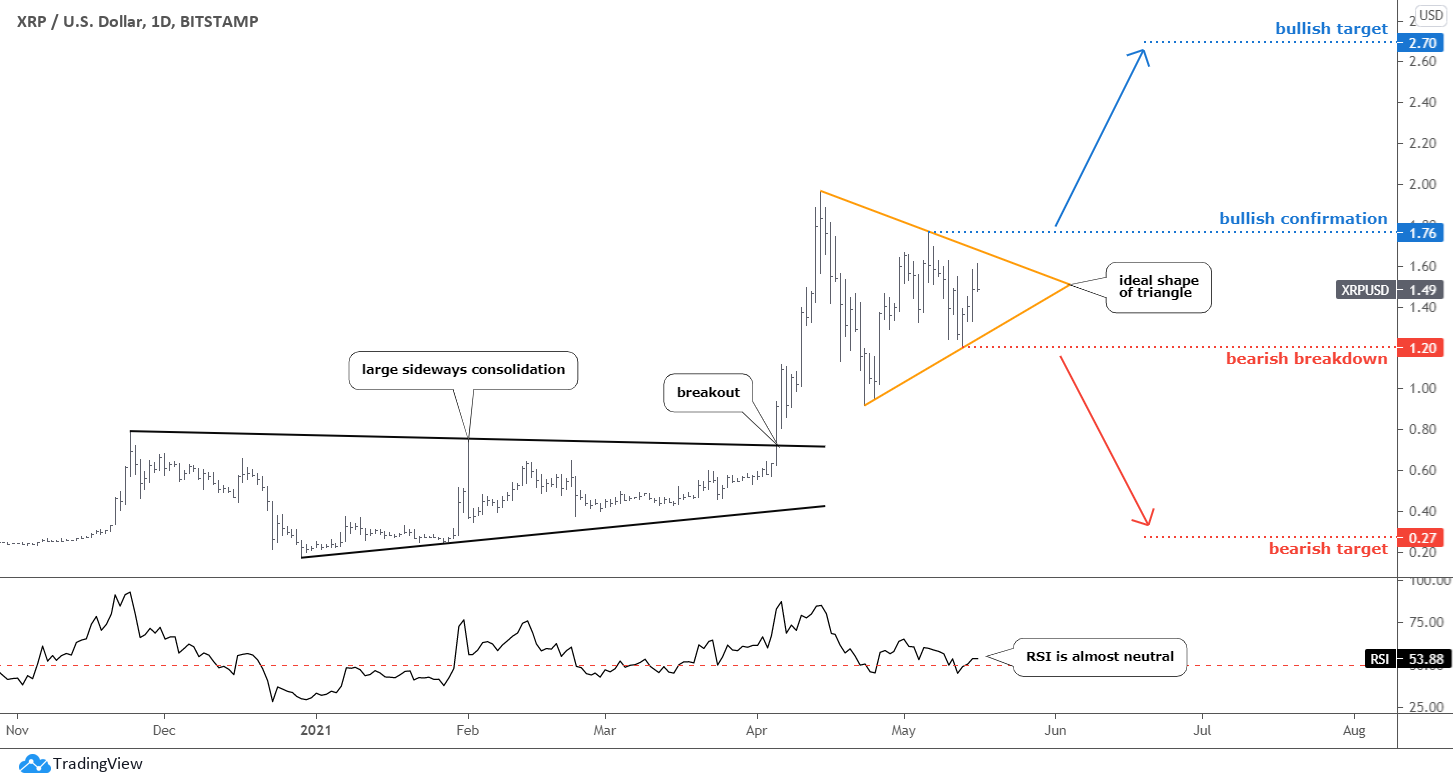
Ripple was in a large sideways consolidation (black trendlines) for more than four months between November 2020 and April 2021 until it finally broke out to the upside. The following rally was quite impressive as the price of Ripple gained more than 170% at an all-time high of $1.97 established this April.
After the robust growth, the price reversed, almost losing all its gain the same month when it reached the low of $0.92. It was an 85% retracement calculated from the breakout point.
The following series of lower peaks and higher lows built a famous triangular pattern of the ideal shape (orange). The price is right in the center of the pattern and the RSI, which hovers around the neutral level.
The odds are even as the price could break the pattern on either side. The bullish confirmation triggers sit on the top of the previous peak at $1.76. The Bearish breakdown level is located in the previous valley of $1.20. Targets are at the distance of the widest part of the Triangle added/subtracted from breakout points. The bullish target is at $2.70, and the bearish one is at $0.27.
Human history shows that progress never stops. Green energy slowly substitutes fossil fuels, cars replaced horses, and not all pioneer carmakers survived. We see that more and more crypto platforms rolled out recently, like Flow and Internet Computer, to name a few. They boast of making a revolution as they consider the previous experience with all the achievements and failures.
Intelligent trades!
Aibek Burabayev
INO.com Contributor, Metals
Disclosure: This contributor has no positions in any stocks mentioned in this article. This article is the opinion of the contributor themselves. The above is a matter of opinion provided for general information purposes only and is not intended as investment advice. This contributor is not receiving compensation (other than from INO.com) for their opinion.
Tesla cars are burning up our fossils fuel more so than miners. Stop buying his garbage
the head-and-shoulders drawn here looks very arbitrary. The real head-and-shoulders gives a downside target of $35,800, which was hit yesterday (and then some, low was $30,010). According to this, all good now. Correction was heavy -- as so often, with 35% down being nothing unusual -- but seems to be completed either way.
Dear Mark,
This is the perpetual thing about patterns - we can see it differently. I see your way of drawing this pattern - my double head is your left shoulder and head. Both targets were hit.
I am not sure if this correction is over as this pattern together with other major reversal models (double/triple tops) could be dangerous as they could bring the total reversal of the trend.
At least one more drop to retest the recent valley could occur. Let’s wait and see.
I will update on cryptos in one of coming posts, please stay tuned.
Stay well, Aibek
Your anaylsis was spot on for BTC. However XRP has not reach the 0.27 and Etherium fell a lot more than 2880.
What is your current analysis after the fall?
Parabolic upturn
Dear YS,
Thanks for your comment and a warm feedback on Bitcoin call.
There is still time for XRP as Bitcoin collapse shows that the main coin is still the ruler.
Ethereum dropped heavily as well below regular retracement area as cryptos under pressure. It could signal about the change of entire structure as this coin hit all three preset targets.
I will update on cryptos in one of coming posts, please stay tuned.
Best wishes, Aibek