
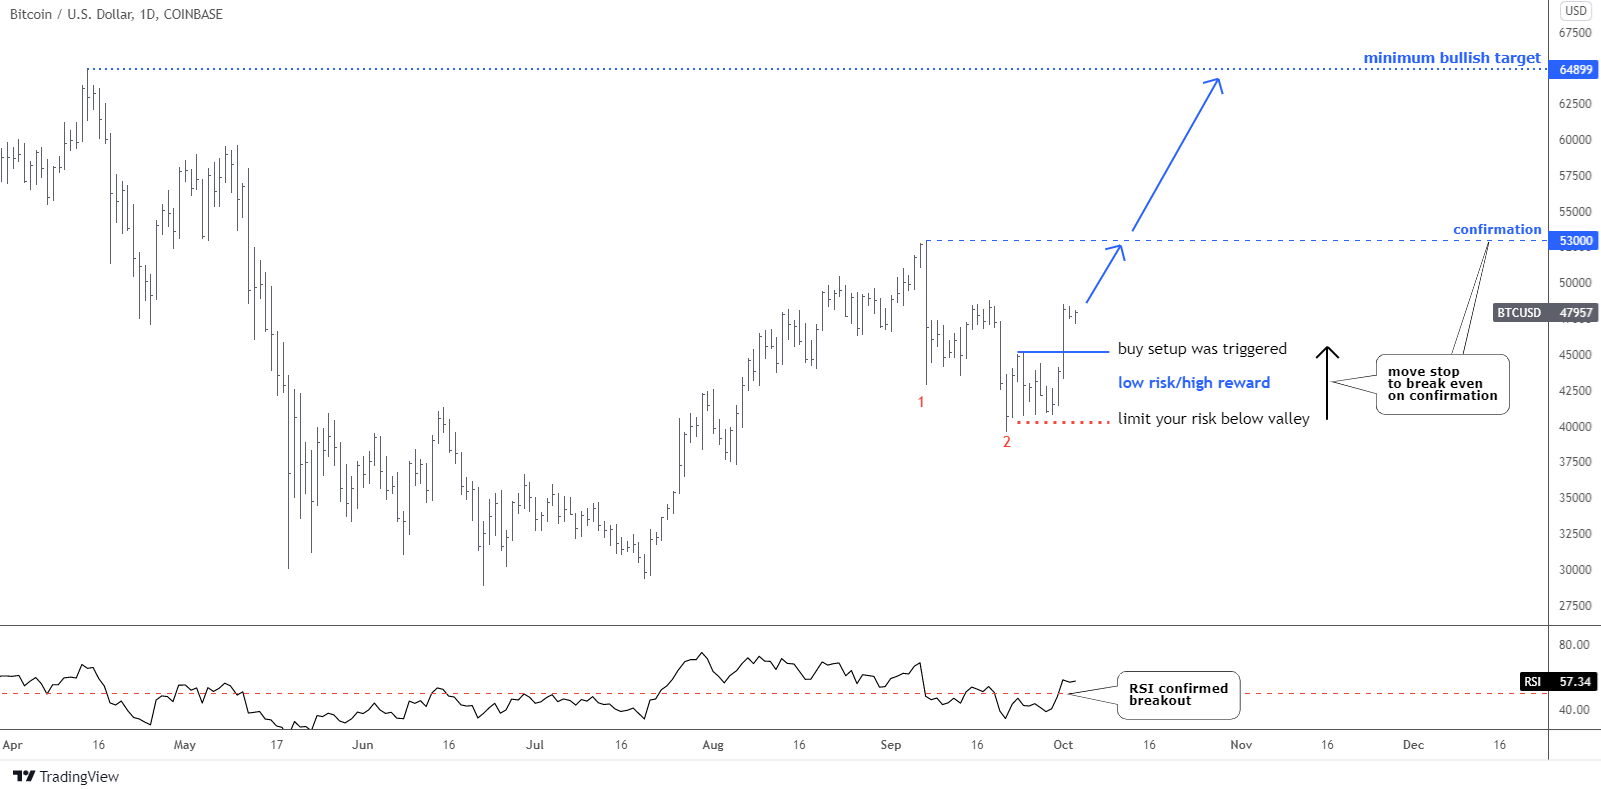
Last Wednesday, Bitcoin rallied to its highest price ever, reaching just over $67k. The minimum bullish target at the previous all-time high that was preset at the start of the month has been hit. The majority of readers guessed it right.
What's next? I see at least two opposite perspectives. Let us see them one by one.
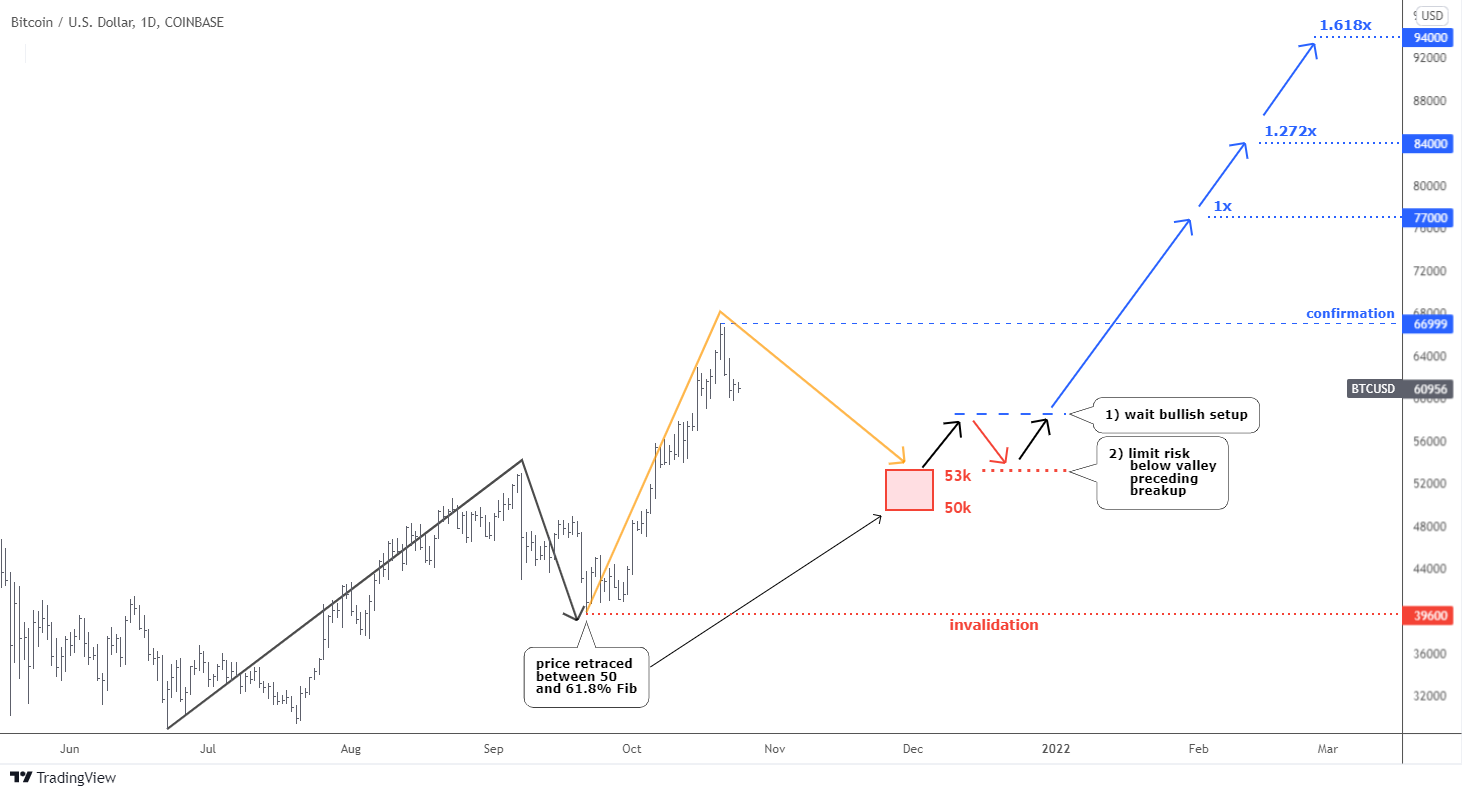
The chart above is based on the assumption that the next significant move is kicking off now after a considerable retracement from April to June this year.
We can see the repeat of the previous buy setup marked with a black zigzag in the new orange zigzag. The recent upside move was retraced in the range between 50% and 61.8% Fibonacci retracement levels. The red box under the orange down arrow highlights the area of the same size correction between $50k and $53k. One should watch this area if the price is reversed there.
After correction, the price could build the buy setup highlighted with black and red arrows. You can find actual buy setups in the chart for the clue: the first one is located between the end of June and the end of July, the other one is smaller and can be found between the end of September and the start of October.
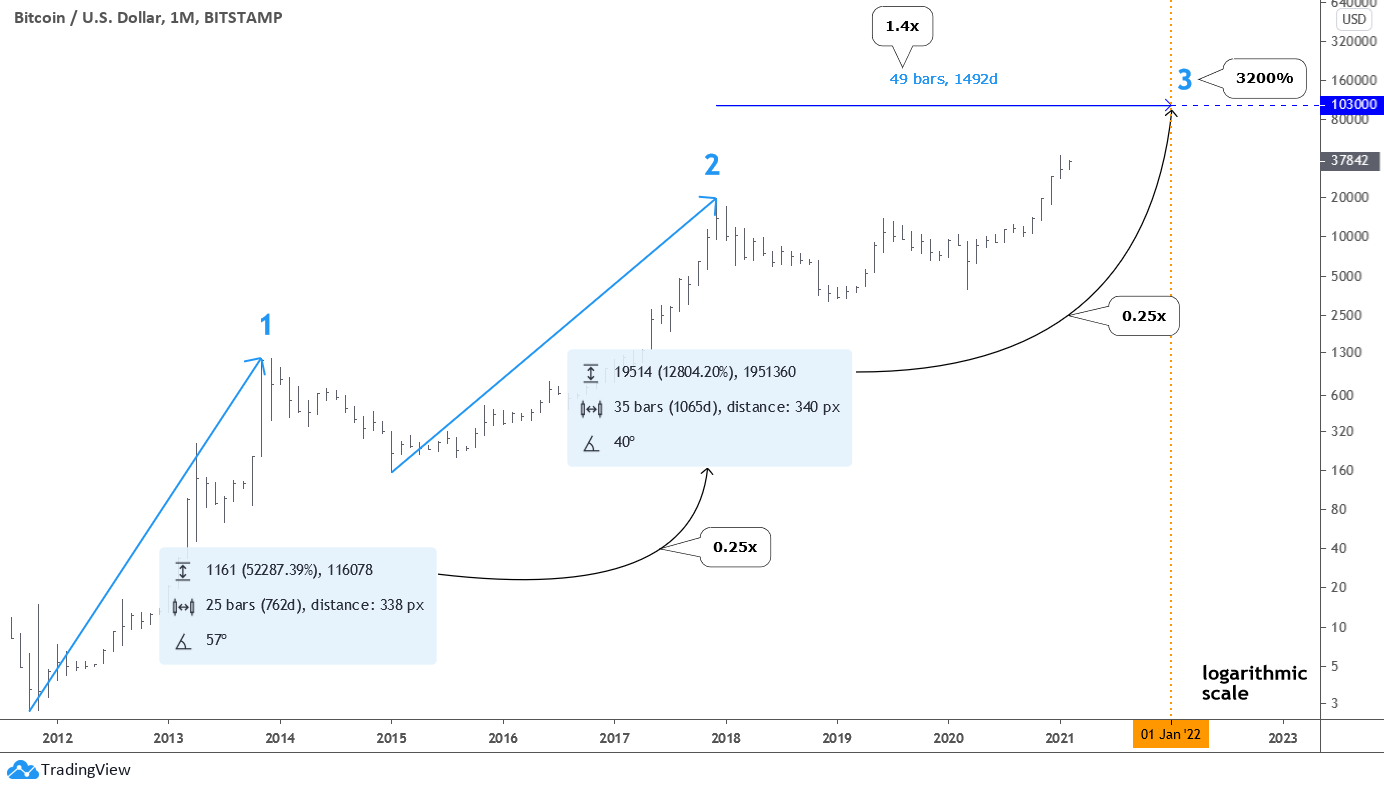
Since we do not know when and where the current drop will stop, all the target levels are preliminary, and we should adjust them when the actual valley is established. I took the $50k level as the valley for my calculations and set three possible targets. The target of an equal distance with the preceding move up (1x) is at $77k. The next is a 1.272x ratio-applied target at $84k. The ambitious one is located at the 1.618x of the previous move near the hyped level of $100k that I covered in my February post.
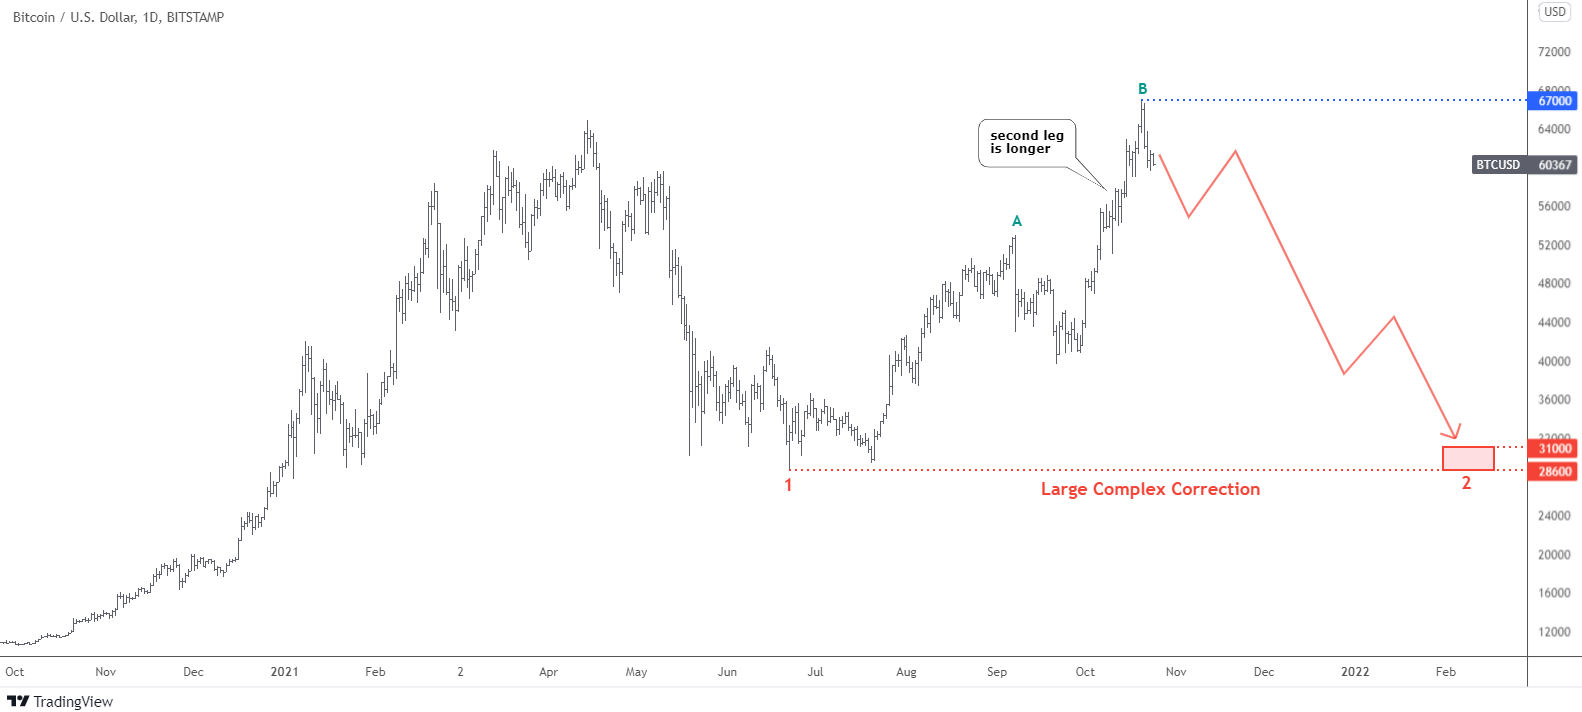
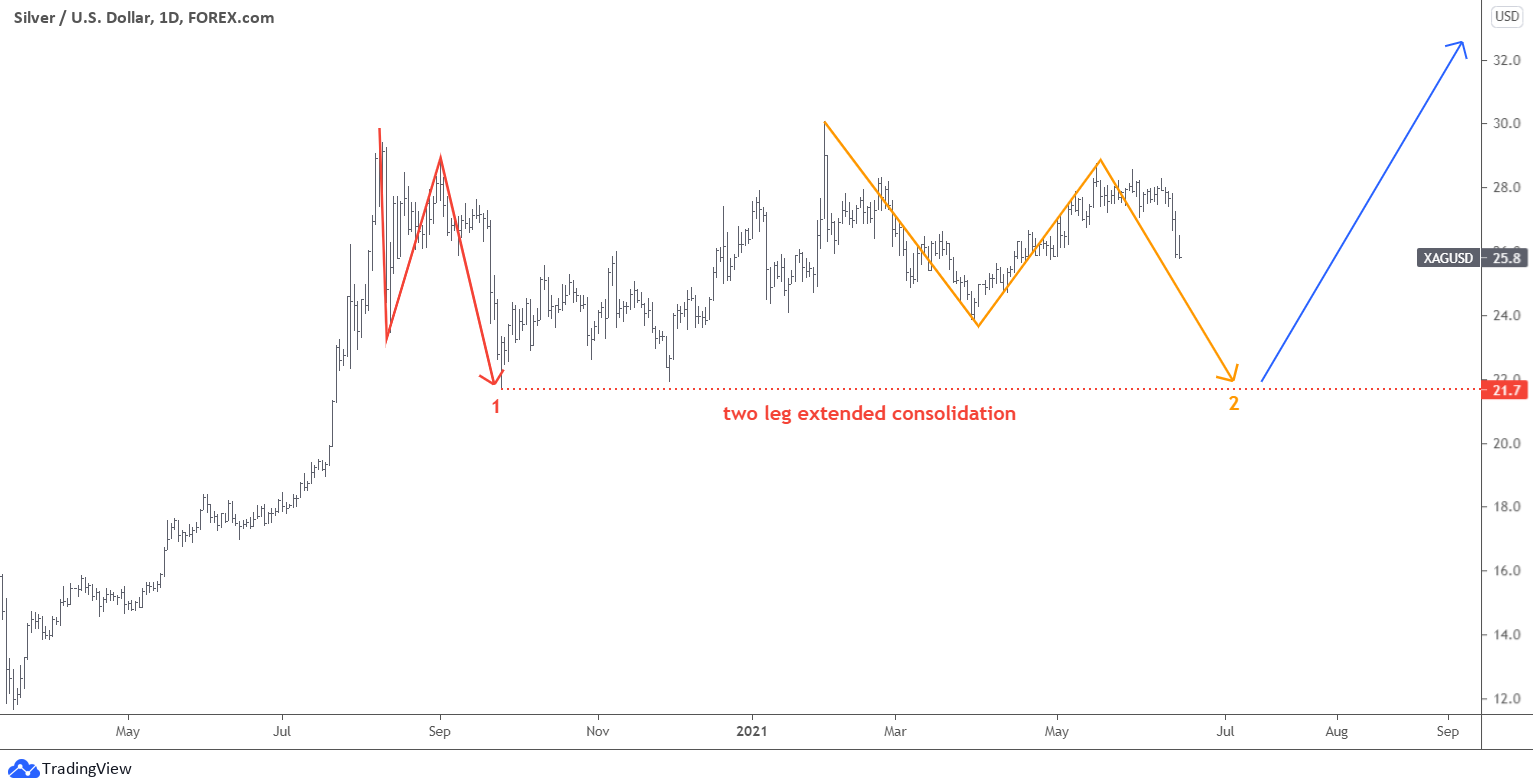
We cannot rule out the second option of a large complex correction. We saw it many times on different time frames and in various financial instruments. The recent example is the huge correction of the silver price that I covered this month.
From this perspective, the outlook is quite problematic for "HODLers" as the price could collapse to retest the valley of red leg 1 at $28,600. It is a considerable drop. I copied the structure of the first red leg down into the possible second red leg down within a 5-legged zigzag.
The joint between red legs emerged within two green legs up marked as "A" and "B." The green B leg is extended as it almost reached the 1.272x of leg A. Therefore, the start of possible red leg 2 was established higher. This could result in an undershot above the valley of red leg 1, hitting only $31k instead of $28.6k. However, this will not cheer up bulls, as it still means the hard drop.
This scenario will be invalidated once the price of Bitcoin overcomes the new all-time high beyond $67k. However, this scenario could become the main one if the price dips below 61.8% Fibonacci retracement level under $50k.
Intelligent trades!
Aibek Burabayev
INO.com Contributor
Disclosure: This contributor has no positions in any stocks mentioned in this article. This article is the opinion of the contributor themselves. The above is a matter of opinion provided for general information purposes only and is not intended as investment advice. This contributor is not receiving compensation (other than from INO.com) for their opinion.
Bueno no entiendo bien pero con el tiempo lo entenderemos
"Well I do not understand well but in time we will understand"
- Translated With Google Translate
After a breathless journey to reach the target a pause and consolidation is in order............
Dear Mr.Schweitzer, you hit it right describing natural market stages.
Thanks for sharing, best wishes!
Aibek
I picked other because you didn't include "nothing". Bitcoin will consume it all.
Dear Mr.Parrish, indeed, it is a sharp one! Thanks for reading and sharing!
Best wishes, Aibek