A Game Plan To Make Money In 2015

One of the things I find fascinating about trading and investing is that the majority of traders do not have any kind of game plan or strategy to navigate the markets and make money. They just sort of wing it. Imagine going across the country where you are not familiar with the roads. You could wing it, but why would you when you have a GPS in your smartphone giving you directions. Traders who wing it in the markets tend to listen to all the market rumors and noise that’s out there and can miss the big moves. They bounce around like a pinball from one idea to the next, hoping to hit it big in the markets. The chance of making money like that is not good.

Imagine having a financial "GPS", much like your smartphone, that keeps you on track to accumulate steady gains year in and year out. Imagine how much happier that would make you feel and how much faster you would reach your financial goals.

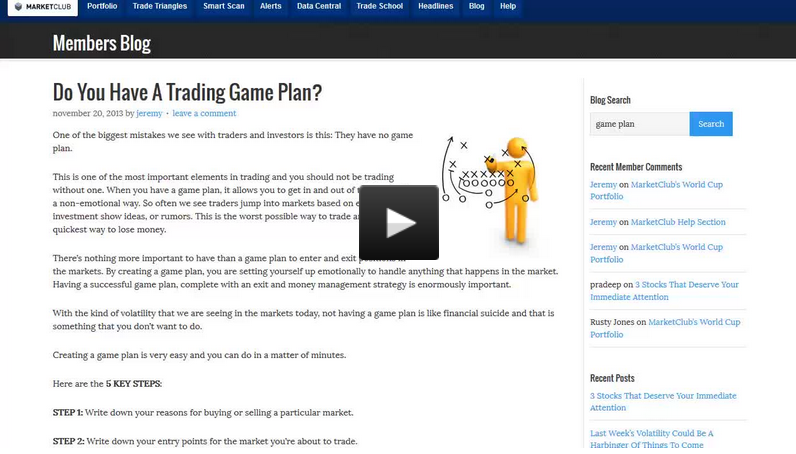
In today's short video, I'm going to share with you all the ins and outs of creating and employing a game plan that you can put to work right away. This simple game plan is easy to use, makes sense and can easily be incorporated into any portfolio.

So just like the GPS on your smartphone, let this financial "GPS" work for you and show you the pathway to an easier life and a potential world of profits.

Every success with MarketClub,
Adam Hewison
President, INO.com
Co-Creator, MarketClub

3 Stocks That Deserve Your Immediate Attention

One of the tools I really like about MarketClub is the Trade Triangle technology. Yesterday, the Trade Triangles alerted me to three potential stocks that could become big winners in the near term. Each of these three stocks flashed major buy signals on Monday, based on the monthly Trade Triangle indicator.

What is also interesting, is the fact that each of these three stocks are coming from powerful chart formations. The technical picture augers very well for these stocks to continue their upward trend.

In today's short video, I'll focus on each of these stocks and show you what the potential is on the upside. I'll also share with you the risk to the downside.

Always remember, there are no guarantees in trading. I'm sure you know that by now. If you don't, consider yourself educated with the truth.

As always I appreciate your feedback and comments below every blog posting. You can agree or disagree with my findings, but do share with us your reasons why.

Every success with MarketClub,
Adam Hewison
President, INO.com
Co-Creator, MarketClub

Last Week's Volatility Could Be A Harbinger Of Things To Come

There's a war going on right now and I don't mean overseas, I mean right here in the markets. Last week was a perfect example as the intraday swings of the S&P500 clocked in at a staggering 6.5%. Market volatility often is a precursor of things to come, and the irony of all this action was that the market closed with a loss of -0.65% for the week.

The net weekly change for the DOW was -0.53% and there was an even smaller loss of -0.42% for the NASDAQ. All three indices formed an important Japanese candlestick pattern, a weekly doji candle. Why is this important? A doji candlestick often signals indecision in the market. When the doji forms in an uptrend or downtrend, this is normally seen as significant, as it is a signal that the buyers are losing conviction when formed in an uptrend and a signal that sellers are losing conviction if seen in a downtrend.

What To Watch For This Week

A lower weekly close would indicate to me that the buyers are beginning lose control of this aging bull market. Here is the "line in the sand" for each of the indices that I am watching. Once below this line, watch for heavy liquidation to come in across the board.

DOW: 17.262
S&P500: 1,992
NASDAQ: 4.090

Gold Is Now Officially On The Move

You might remember on January 7th, I wrote a post on gold (FOREX:XAUUSDO) and the key neckline level. The key neckline in gold was broken to the upside last Friday when gold closed out the week with a very positive 2.9% gain. I now have a confirmed upside target zone of $1,340, which equates to about $132-$134 on the ETF, GLD. To follow all of the entry and exit points for gold, check in daily with the World Cup Portfolio. Continue reading "Last Week's Volatility Could Be A Harbinger Of Things To Come"

Practical Applications of Candlestick Charts

This audio lecture along with the downloadable PDF workbook covers and discusses practical trading approaches, including stop placement and trailing levels, risk parameters, money management and the psychology of trading any market with Japanese Candlesticks. The information derived by using this approach can directly influence the day-to-day decision process, which can enhance your awareness of the markets. You will learn the basics of Japanese Candlestick charting, as well as how to combine them with Western technical tools such as trend lines, DeMark Sequential, moving averages, stochastics, and may other standard technical tools.

Developed over three hundred years ago, this method of technical analysis is still relevant and an exceptional addition to Western technical analysis. By combining both approaches to market forecasting, one is able to take the best from both schools. Gary Wagner believes that the outcome from this combination is capable of extending the benefits of any methodology.

LISTEN NOW: Practical Applications of Candlestick Charts

Best,
The INOTV Team

The Internet Portfolio Hit The Jackpot In 2014

Last year was another good year for the stock market with all the indices ending up on a positive note.

The DOW was able to make it into the positive column by 7.5%, the S&P 500 managed to outdo the DOW with a double digit return of 11.5% and standing on the top of the hill was the NASDAQ index, which put in a stellar 13.9% performance for the year.

What if there was another way to make money, one that had about the same amount of risk, but produced higher returns on your money - now that would that be interesting, don't you think?

Two years ago, we started our model Internet portfolio which consists of 5 stocks. We divided the funding for this portfolio into 5 equal amounts of $10,000 each and used that to trade as many shares as we could both from the long and short side of the market.

The stock we chose to trade in this Internet portfolio are Facebook Inc.(NASDAQ:FB), Netflix Inc. (NASDAQ:NFLX), Yahoo! Inc. (NASDAQ:YHOO), Yelp Inc. (NYSE:YELP), and finally Amazon.com Inc. (NASDAQ:AMZN). Based on the stock's price, we traded the maximum number of shares we could for each stock, rounding down if needed.

The first year tracking this portfolio (2013), we had a stand out year with a return of 65.3%. Last year (2014) this portfolio performed well, easily outperforming all the major indices and beating the top performing NASDAQ. For 2014, the Internet portfolio put in a super performance of 16.4%. While not as good as 2013, it was nevertheless a very positive one when you measure it against other stock portfolios.

The signals for this portfolio, along with our other two model portfolios, the World Cup portfolio and the Perfect ETF portfolio are provided for you.

If you are looking to start 2015 off on the right foot, with a clear direction, then one of these model portfolios could be the answer you are looking for. Each portfolio carries, like all investments, a degree of risk.

The most conservative portfolio is our Perfect ETF portfolio. The Internet portfolio has a slightly higher degree of risk. Our World Cup portfolio carries the most amount of risk and is not for everyone. However, it does have a place in large portfolios as a non-correlating asset class.

Have a question about the Internet portfolio? Please comment below this post.

Every success in 2015 with any of MarketClub model portfolios!

Adam Hewison
President, INO.com
Co-Creator, MarketClub