Using Technical Analysis Indicators
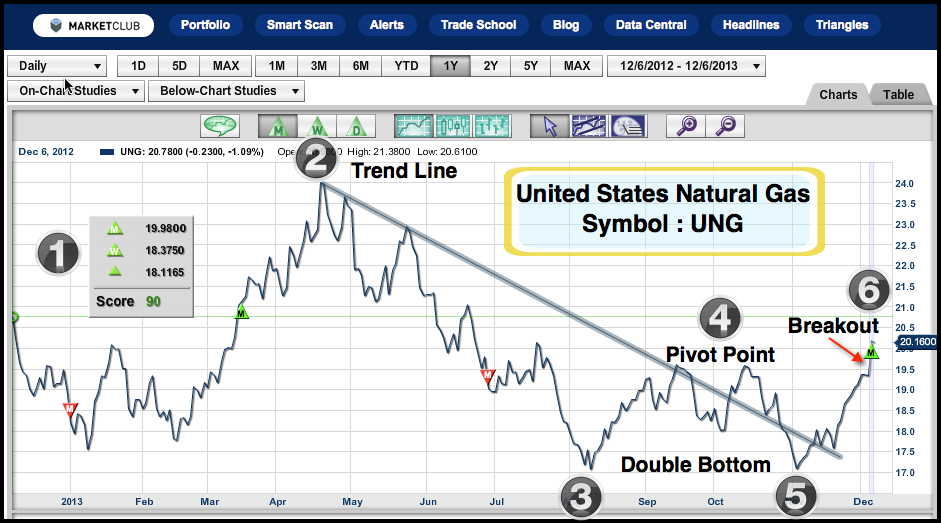
Technical analysis is a method of examining past market data to help forecast future price movements. Using different tools, indicators, and charts, traders can spot important price patterns and market trends, and then use that data to anticipate a market's future performance.
Technical analysis is based around a market's price history, rather than the fundamental data like earnings, dividends, news, and events. The belief is that price action tends to repeat itself and the patterns can be identified and used to define a market's trend.
Since MarketClub offers a variety of chart studies that can be helpful in your technical analysis, I'd like to highlight several of the most popular technical indicators and how you can use them.
The Moving Average Convergence/Divergence (MACD) Indicator
Continue reading "5 Must-Know Indicators - Technical Analysis For Beginners"
 Hello traders everywhere! Adam Hewison here, President of INO.com and co-creator of MarketClub, with your
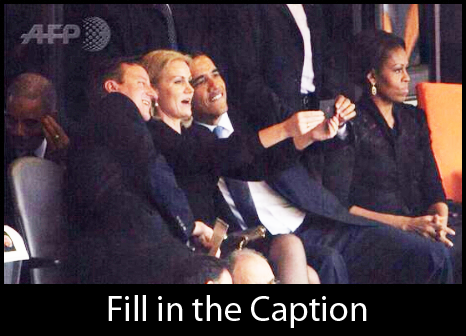 Leave a comment on what you think would be the “perfect caption” for this photograph of President Obama, taking a “selfie” with Danish Prime Minister Helle Thorning Schmidt and U.K. Prime Minister David Cameron at the Nelson Mandela memorial service. What was the president doing and more importantly, what was First Lady Michelle thinking.