Why Trade Triangles Matter For 2014

Today, I'm going to be looking at two stocks and their recent Trade Triangle signals.

Netflix (NASDAQ:NFLX)

Netflix, Inc. (NASDAQ:NFLX) provides Internet television network service that enables subscribers to stream TV shows and movies directly on TVs, computers, and mobile devices in the United States and internationally.

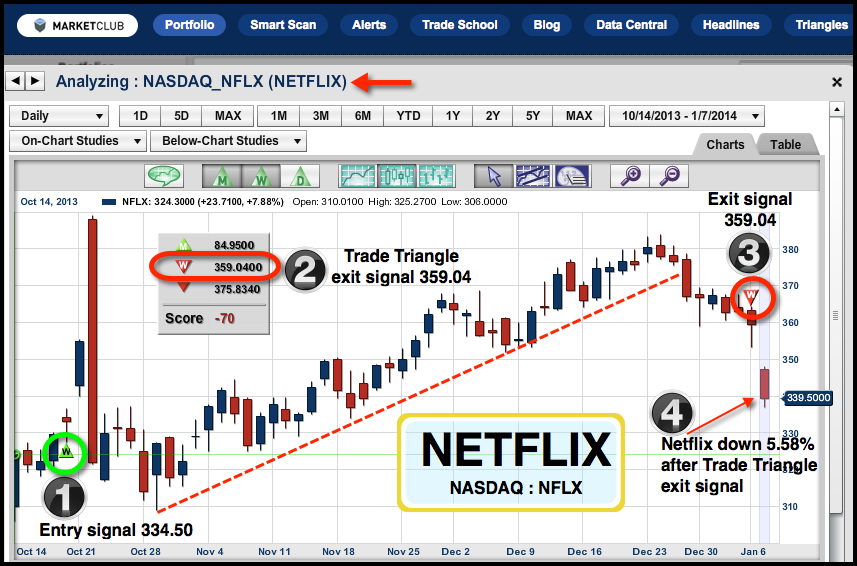
Netflix had a recent Trade Triangle exit signal at $359.04 on 1/6/14. The very next day this stock dropped like a brick and shaved 5.58% off the value of this company. That’s why Trade Triangles matter.

Want to analyze Netflix Inc.(NASDAQ:NFLX) or another symbol? Try our Free Stock Trend Analysis Report.

BLACK CHART NUMBERS
1. Weekly Trade Triangle entry signal @ $334.50
2. Trade Triangle information
3. Weekly Trade Triangle entry signal @ $359.04
4. Netflix down 5.58% in one day.

To summarize, I expect Netflix to be on the defensive in the near-term, unless I see otherwise in the Trade Triangle technology. Continue reading "Why Trade Triangles Matter For 2014"

On My Radar Today - Solarwinds, Inc. (NYSE:SWI)

Today, I'm going to be analyzing the stock of SolarWinds (NYSE:SWI).

SolarWinds, Inc. designs, develops, markets, sells, and supports enterprise-class information technology (IT) and infrastructure management software to IT professionals in various organizations worldwide.

Solarwinds SWI Analysis

The most outstanding chart feature to me is the 10-month long term downtrend line, which has seen a breakout to the upside. This trend line touches three price points, making it a valid and important trend line. Continue reading "On My Radar Today - Solarwinds, Inc. (NYSE:SWI)"

Change = Opportunity = Gold

Let's face it, without change, there can be no opportunity. As traders and investors, we need to see change in order to make money.

One potential opportunity in 2014 could be gold. In 2013, gold suffered what was perhaps its worst performance as an asset in decades, losing over 25% of its value for the year. This was the first time that gold had a year-to-year loss that I can remember. So in 2014, the question has to be, what's going on with gold and is it going to redeem itself?

Looking at the chart which begins in July of 2012, you can see that gold hit its high and then basically for the next 15 months moved consecutively lower. This high is not the all-time high that was seen in August of 2011 at $1904, but the most significant high for our chart work. Continue reading "Change = Opportunity = Gold"

On My Radar Today - BB&T (NYSE:BBT)

Today, I'm going to be analyzing the stock of BB&T (NYSE:BBT).

BB&T Corporation is a financial holding company. BB&T conducts its business operations primarily through its commercial bank subsidiary, branch bank, and other non-bank subsidiaries.

Now that we have the basics of how BB&T operates, let's take a look at the chart. The most outstanding feature to me on this chart is the long term trend line. This trend line touches five price points, making it a very powerful and important trend line in the future.

BB&T chart

The RSI is trending over the midpoint 50 line, indicating a strong trend. Plus, all of the Trade Triangles are green and positive. The last major trend Trade Triangle signal was on 12/13/13 at $35.58. Continue reading "On My Radar Today - BB&T (NYSE:BBT)"

Two Killer Chart Setups

I get excited when I see these chart setups forming, as I know the odds are extremely high that they will work and make money. What amazes me is after years of investing and trading, these chart setups keep recurring year after year and still work.

These two killer chart setups can be found in stocks, futures, metals, Forex, and ETFs. When presented with certain obstacles and challenges, humans overall act in a predictable way. Charts reflect all the good and bad parts of human nature and that is why chart patterns and economic cycles keep repeating themselves over and over again.

In this step by step video, I show you exactly what to look for in a chart and how to measure how far each move from my two killer chart setups can run. Continue reading "Two Killer Chart Setups"