ETFs for a Strong Dollar

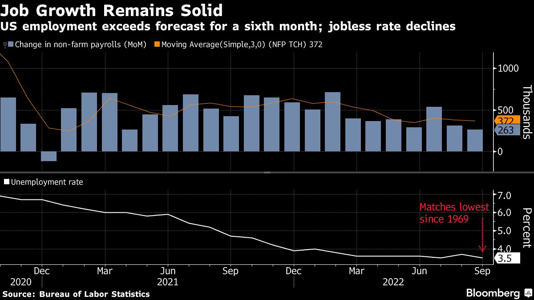
Since the Federal Reserve started raising interest rates, we have seen a dramatic increase in the US dollar. The main reason is that the dollar is becoming a more attractive investment for investors at home and worldwide.

There are a lot of dynamics at play that investors need to consider when the dollar is rising. Such as, a rising dollar will hurt domestic companies that sell internationally because the exchange rate lowers their profits. However, companies that import raw materials will benefit from a strong dollar.

Due to the strong dollar, some emerging markets will suffer if they borrow in dollars. This happens because it becomes harder for borrowers to pay back their debt as the dollar strengthens. Furthermore, these same countries can get hit with a double whammy if they also import many US goods since those goods will now be more expensive.

Let us look at a few Exchange Traded Funds that you can buy that will help your portfolio weather this strong dollar storm.

I would like to mention the first two ETFs are also rather obvious picks. The Invesco DB US Dollar Index Bullish Fund (UUP) and the WisdomTree Bloomberg US Dollar Bullish Fund (USDU) both are long the US dollar against a basket of other global currencies.

In plain English, these funds increase when the dollar rises and decline when the dollar declines compared to other international currencies. There is no magic here and nothing fancy going on; if you think the dollar is going higher, buy one of these two funds and hold it for a while.

Another set of ETFs you could buy are dividend-paying ones. Something like SPDR Portfolio S&P 500 High Dividend ETF (SPYD), the WisdomTree US High Dividend Fund (DHS), or my favorite, the ProShares S&P 500 Dividend Aristocrats ETF (NOBL).

These will typically do well when the dollar rises for a few reasons, mainly because the stronger dollar will likely hit the earnings of companies with large exports. But, as companies, especially those in the Dividend Aristocrat group, are very reluctant to cut their dividends, the stock prices of these firms usually hold up better than the non-dividend paying stocks. Continue reading "ETFs for a Strong Dollar"

Poised for the Fed Pivot

Given its past history, both over the long term and especially more recently, it’s inevitable, if not a given, that the Federal Reserve will screw up. This time should be no different. When exactly this will manifest itself is hard to say, but it may be soon—possibly before the end of this year or in early 2023.

The Fed, as we know well, grossly inflated prices and asset values post-pandemic by sticking too long to an overly accommodative monetary policy, holding its benchmark federal funds level at zero percent as recently as March and continuing to buy Treasury bonds, long after inflation was shown to be a lot more “transitory” than the Fed thought.

Now we are all paying the price for the Fed’s belated realization that it was wrong about inflation, as it has raised interest rates five times in the past six months, to 3.00%-to-3.25%, including 75 basis points at each of its past three meetings, and shows few signs of intending to sit and wait and see how those rate hikes will affect the economy.

In the process, the Fed has basically chucked the second piece of its dual mandate, namely maximizing employment, in order to slay the inflation beast.

The American consumer and investor are thus no better than pawns in the Fed’s game of trying to fix a situation it largely created by itself, yet there is no reason to believe that its current policies are any better or smarter than its previous prescriptions, which involved flooding the financial markets with buckets of cheap money it didn’t need.

Now it’s trying to undo all that in a few short months, all while trying not to steer the economy into the ditch, although perfectly happy to throw people out of work and gut their retirement portfolios.

(Question: If the Fed’s actions will force some people to keep working or rejoin the labor force—and there are still plenty of job openings—doesn’t that work against its plan to reduce employment?)

At some point — sooner rather than later, we hope, but no doubt later than everyone else — the Fed will suddenly come to the conclusion that it’s gone too far with tightening and will start to take its foot off the monetary brakes. It may not start to lower interest rates, necessarily, but at least take a breather and see what effect its recent new-found hawkishness has had on inflation and economic growth. Continue reading "Poised for the Fed Pivot"

Two Standouts in the Gold Sector

While the cyclical bear market in the S&P-500 (SPY) has created buying opportunities, the real value can be found in the Gold Miners Index (GDX).

This is because the sector has endured a 22-month bear market, sending many names down 60% from their highs.

Although several names offer compelling buying opportunities, two stand out as offering a rare mix of growth and value. These are i-80 Gold (IAUX) and Sandstorm Gold Royalties (SAND).

Investing in the precious metals sector can be treacherous and intimidating, with several names to choose from, multiple pitfalls, and lengthy technical reports describing each mine.

For this reason, the sector is often avoided by generalist investors. The proposition becomes even less interesting if we mix in a declining gold price.

However, there is one key trait in gold miners that allows investors to worry less about the gold price: production growth. The key is selecting names with growth and low-risk business models with a high probability of successful execution, which is easier said than done.

Sandstorm Gold Royalties (SAND)

Sandstorm Gold Royalties is a precious metal royalty/streaming company, giving it a lower-risk business model within the sector. This is because it provides upfront capital to operators/developers to construct/expand mines, and in exchange, it receives a portion of metal production over the mine life.

The result is that it’s highly diversified (dozens of revenue streams and jurisdictions), and it’s protected from inflation as it doesn’t have to pay for sustaining capital or get hit by rising operating costs.

In addition, it enjoys very high margins (80% plus gross margins), with it simply receiving gold deliveries of metals at a low fee ($10/oz to $500/oz gold) vs. $700/oz to $1,300/oz costs for operators.

The other major benefit of this model is that any discoveries on properties where it holds royalties are gravy, given that the mine can continue to deliver ounces for decades even if the mine life was estimated at only several years initially.

A couple of examples are an investment in Goldstrike which turned $2.0 million into $1.0 billion paid in royalties, and an investment in Cortez which translated to a 500% plus return for Royal Gold. This is why royalty/streaming companies commonly trade at a premium to their net asset value. Continue reading "Two Standouts in the Gold Sector"

How to Interpret the Jobs Report

Friday’s jobs report for September showed a decrease in monthly gains, with 263,000 new jobs added last month, a decline from the prior month in which 315,000 new jobs were added.

The deep impact it had on almost every asset class in the financial markets was not because of the tepid numbers but rather hopes by the Federal Reserve that these numbers would be even lower.

Bloomberg Jobs Graph

The Federal Reserve had hoped that Friday’s report would reveal even slower growth because that would indicate progress by the Federal Reserve in reducing inflation.

Inflation is still greatly elevated at a 40-year high even after the Federal Reserve has raised interest rates at every FOMC meeting since March. The Fed raised rates by 25 basis points in March, 50 basis points in May, and 75 basis points in June, July, and September. The Fed took their benchmark Fed funds rate from between 0 and 25 basis points in February to between 300 and 325 basis points in September.

Although Friday’s report indicated slowing job growth it is believed that this contraction is not enough for the Federal Reserve to slow down its current pace of interest-rate hikes. Continue reading "How to Interpret the Jobs Report"

Familiar Pattern in the AMD Chart

The Fed’s tightening puts hard pressure on the broad stock market and chip makers are not the exception. The strong labor market statistics and ongoing inflation pressure supports the hawkish mode.

If one thinks that the sell-off might be over, there is a chart below that I spotted a disastrous model for a well-known chip maker Advanced Micro Devices, Inc. (NASDAQ:AMD).

You definitely know this chart pattern I spotted for you. It is a Head & Shoulders reversal model. Last time this notorious chart pattern appeared in my posts was in May on the chart of Ethereum cryptocurrency. I updated it for you below to illustrate the historical sample.

ETH Weekly Updated

Source: TradingView

As soon as the price crossed below the Neckline beneath $2,400, Ethereum collapsed as it had lost a tremendous 66% down in the valley of $884 in June from the post level of $2,564.

This is how this model has played out before and that is what we could expect in the next chart of AMD below.

AMD Weekly

Source: TradingView

The Head & Shoulders pattern (pink) here is more balanced compared to up-sloped model in the Ethereum chart. The Neckline touch points are located almost exactly at the same level of $72, hence it is a flat line. The Head is quite tall above the wide Left Shoulder and the narrow Right Shoulder. The top of a latter offers a strong resistance and the invalidation point. Continue reading "Familiar Pattern in the AMD Chart"