Two Restaurant Stocks to Buy on Dips

It’s been a rough year for the restaurant industry, with the index declining over 40% from its highs, and many weaker operators like Red Robin (RRGB) cut in half.

The bear market in these names has been attributed to commodity and wage inflation which has pinched margins, but also due to very difficult year-over-year comps following the surge in traffic from government stimulus and diners anxious to get back to everyday life in Q1/Q2 2021.

Unfortunately, while restaurants should have been out of the woods by Q3 2022 after lapping these insurmountable comps, they’re now contending with a new issue: traffic. This has resulted from shrinking discretionary budgets with consumers hit with rising mortgage payments, rising gas prices, and the cost of groceries continuing to skyrocket.

So, while margins held up relatively due to sales leverage in 2021 and menu price increases, it could prove more challenging to pass on costs this year.

The good news is that while much of the sector has been sold off for a good reason, a few companies are being dragged down with little justification due to the bearish sentiment.

Two companies that meet these criteria are Wingstop (WING) and Restaurant Brands International (QSR), which have found themselves more than 35% from all-time highs. Let’s take a closer look below:

Wingstop (WING)

Wingstop is a mid-cap restaurant company offering classic wings, boneless wings and tenders, and it has enjoyed considerable growth since going public.

The company has seen its store count increase from 998 stores in 2016 to an estimated 1,950 in 2022, translating to an impressive 11.8% compound annual growth rate. This is helped by the company’s phenomenal unit economics (sub-two-year payback), making it an attractive brand for multi-unit franchisees.

So far, the company’s unit growth is not slowing despite its scale, with an estimated 250 stores to be opened in 2023, representing a 13% growth rate.

Although discretionary spending budgets are declining, Wingstop is in a unique position. This is because it has a relatively low average check compared to casual dining restaurants. Besides, while we are seeing commodity inflation in most proteins (beef, seafood, pork), bone-in wing prices are seeing deflation.

So, while other restaurants might be raising prices to protect margins, even if at a slower pace, to ensure they don’t hurt demand, Wingstop could hold prices steady, allowing its value proposition to stand out among its competitors in the quick-service space.

Therefore, Wingstop looks to be an interesting defensive play in the restaurant space, and I would not be surprised to see the stock trade back above $110.00 before year-end.

GDX Chart

Source: YCharts.com, FactSet, Author’s Chart

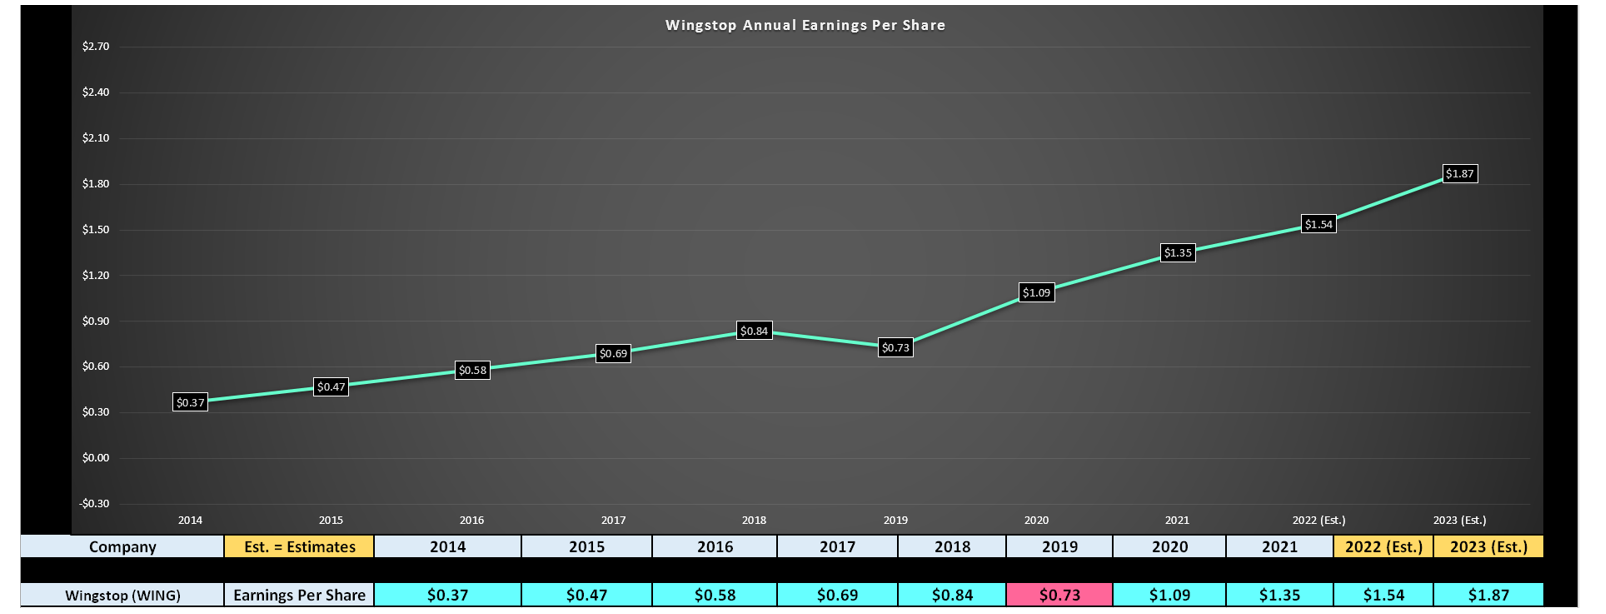
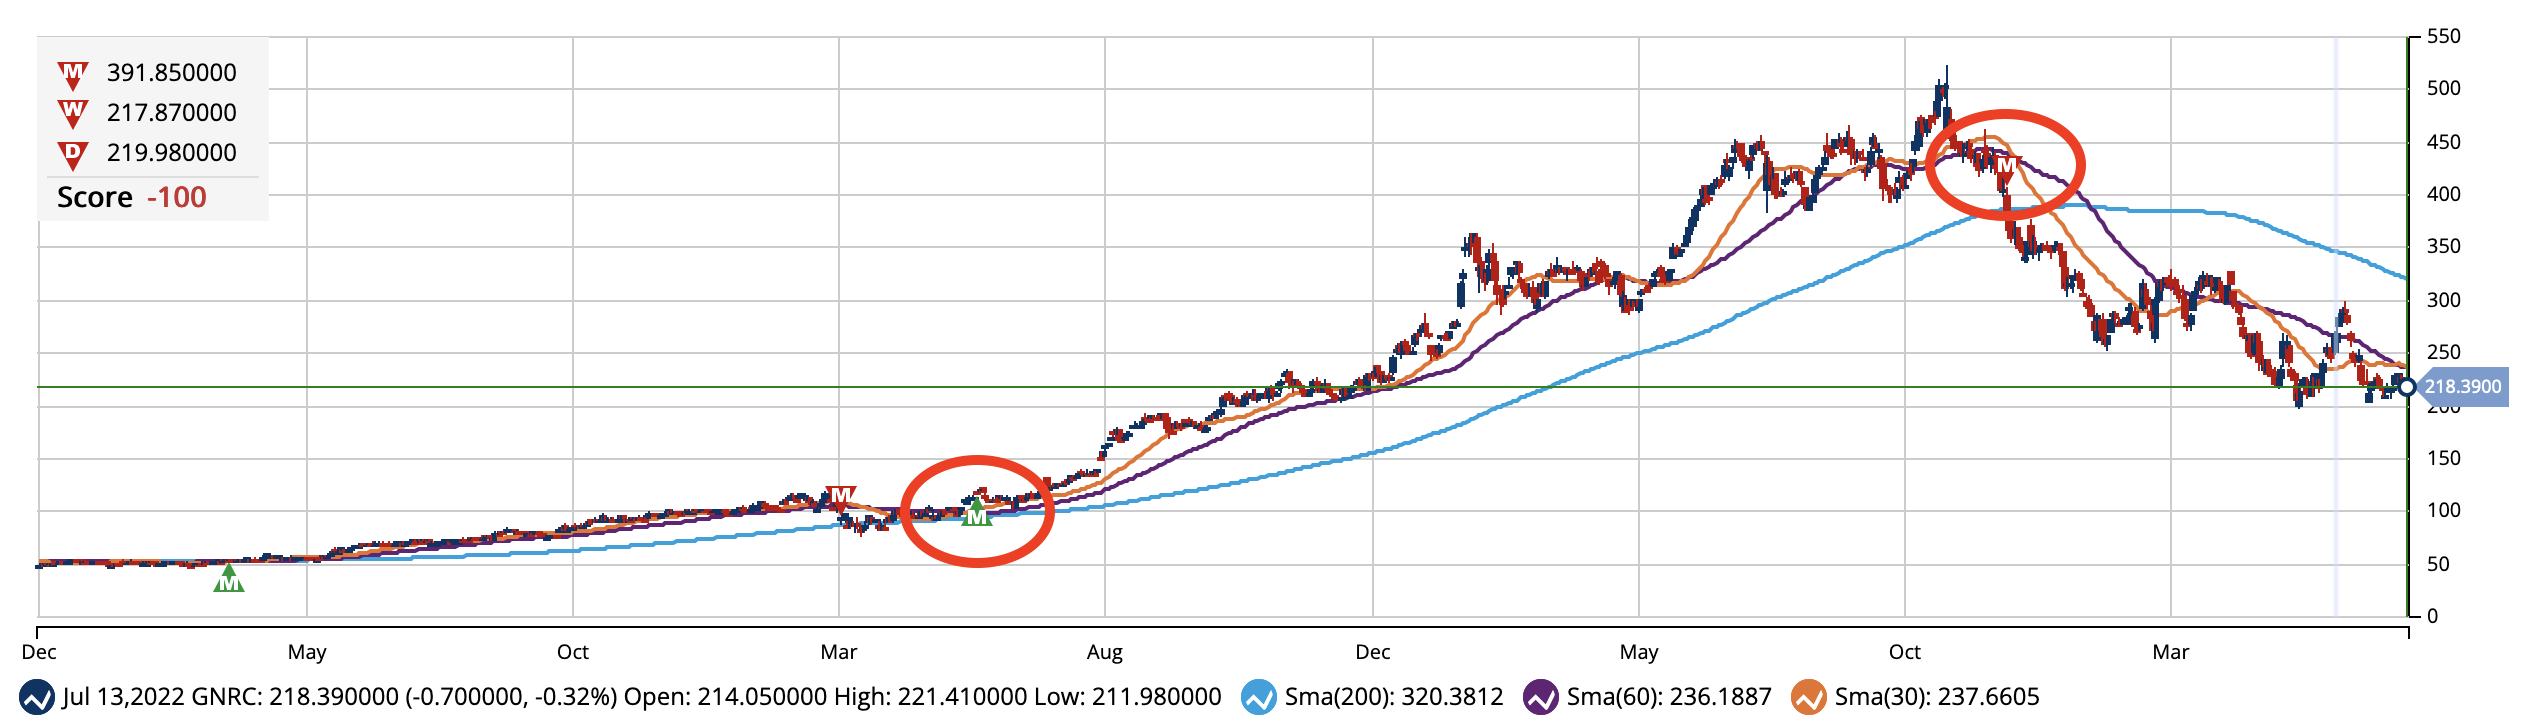
Looking at the chart above, Wingstop is not cheap, which is why I’m not long the stock yet, given that it trades at more than 48x FY2023 earnings estimates ($1.87). However, the stock does deserve a premium multiple given its double-digit unit growth rates and ability to grow earnings at a rate well above that of its peer group.

Based on what I believe to be a conservative EBITDA multiple of 24 and FY2023 EBITDA estimates of $130 million ($4.33), I see a fair value for the stock of $103.90, pointing to an 11% upside from current levels.

However, given that I prefer to buy at a minimum 20% discount to fair value, I think the name is one to keep a close eye on, but the ideal buy zone is at $83.00 or lower on any dips.

Restaurant Brands International (QSR)

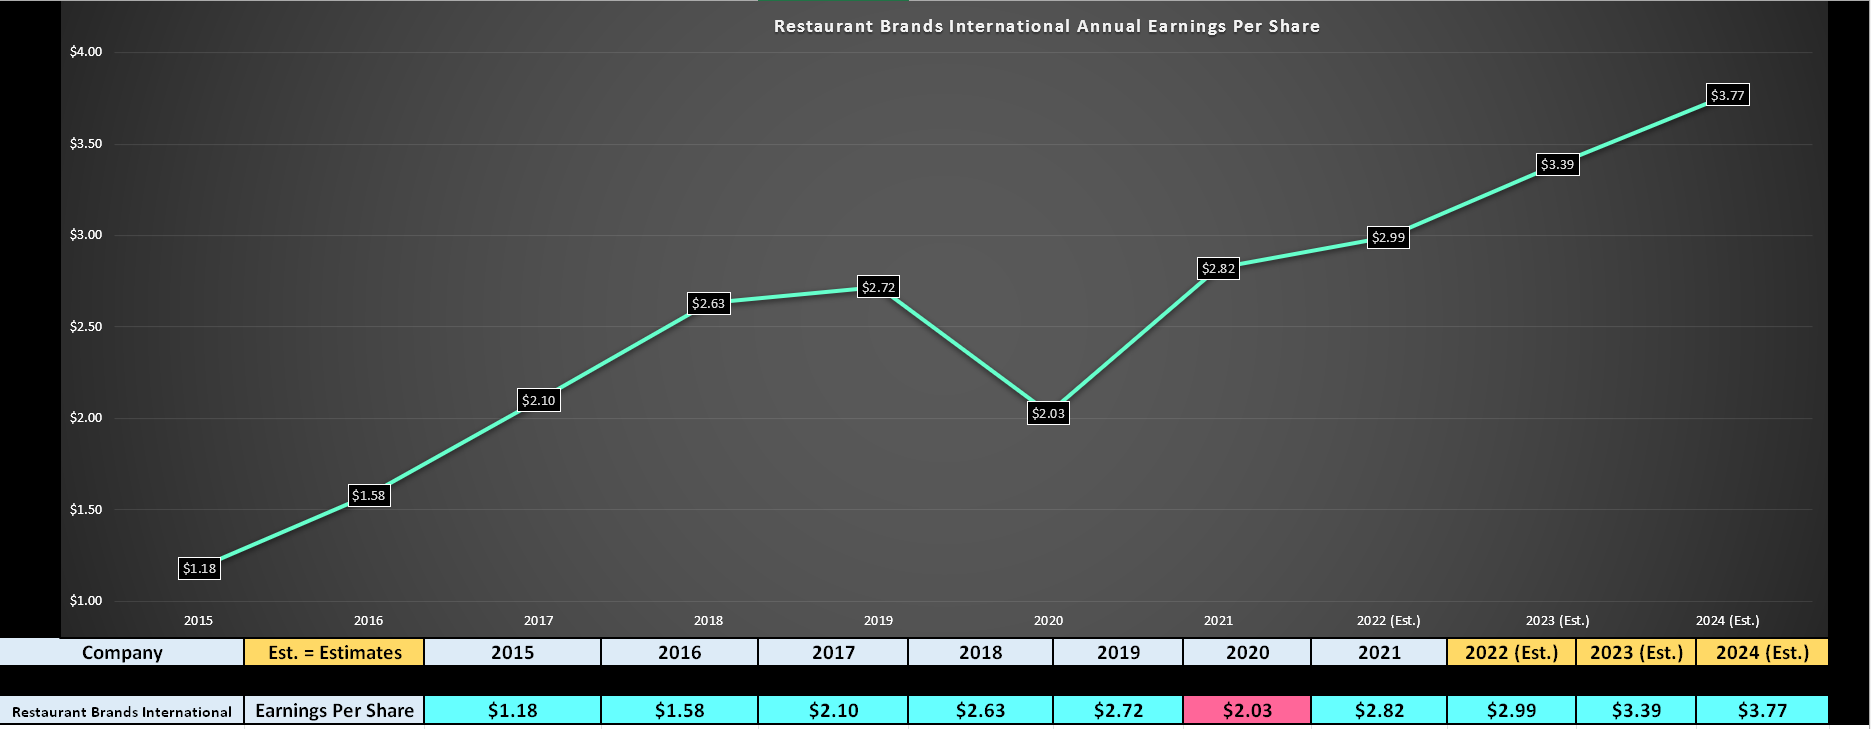
Restaurant Brands International is a large-cap restaurant company with a leading franchised position among its peers, with over 99% of its restaurants franchised.

The company is best known for its brands Popeye’s Chicken, Burger King, and Tim Hortons, but it also recently acquired Firehouse Subs, a rapidly growing, digital-focused sandwich company with over 1,200 restaurants.

This acquisition pushed the company’s total restaurant count to more than 29,000, but it is confident that it can push its total store count above 40,000 by 2027. This would translate to more than 35% growth from current levels, making it more attractive than McDonald’s (MCD), in my view, which is relatively saturated and must rely on same-store sales than global expansion.

The key differentiator for Restaurant Brands is that it could be a trade-down beneficiary. While consumers might cut back in a recession, they are less likely to cut back on things that offer value and convenience. When it comes to a morning coffee/sandwich on the way to work or lunch coffee/snacks like Tim Hortons offers or value meals from Burger King and Popeye’s, I see these as staples more than discretionary items.

In contrast, one might argue that fine dining and casual dining are highly discretionary. Therefore, I do not expect the negative traffic trends that we’re seeing in casual dining to seep into the quick-service space, and if they do, I expect them to be much less pronounced.

I also believe that QSR has a much better chance of mining customers’ data to drive additional visits, given its high proportion of digital sales. Finally, given the lower average check, I see less resistance to menu price increases in quick service vs. casual dining.

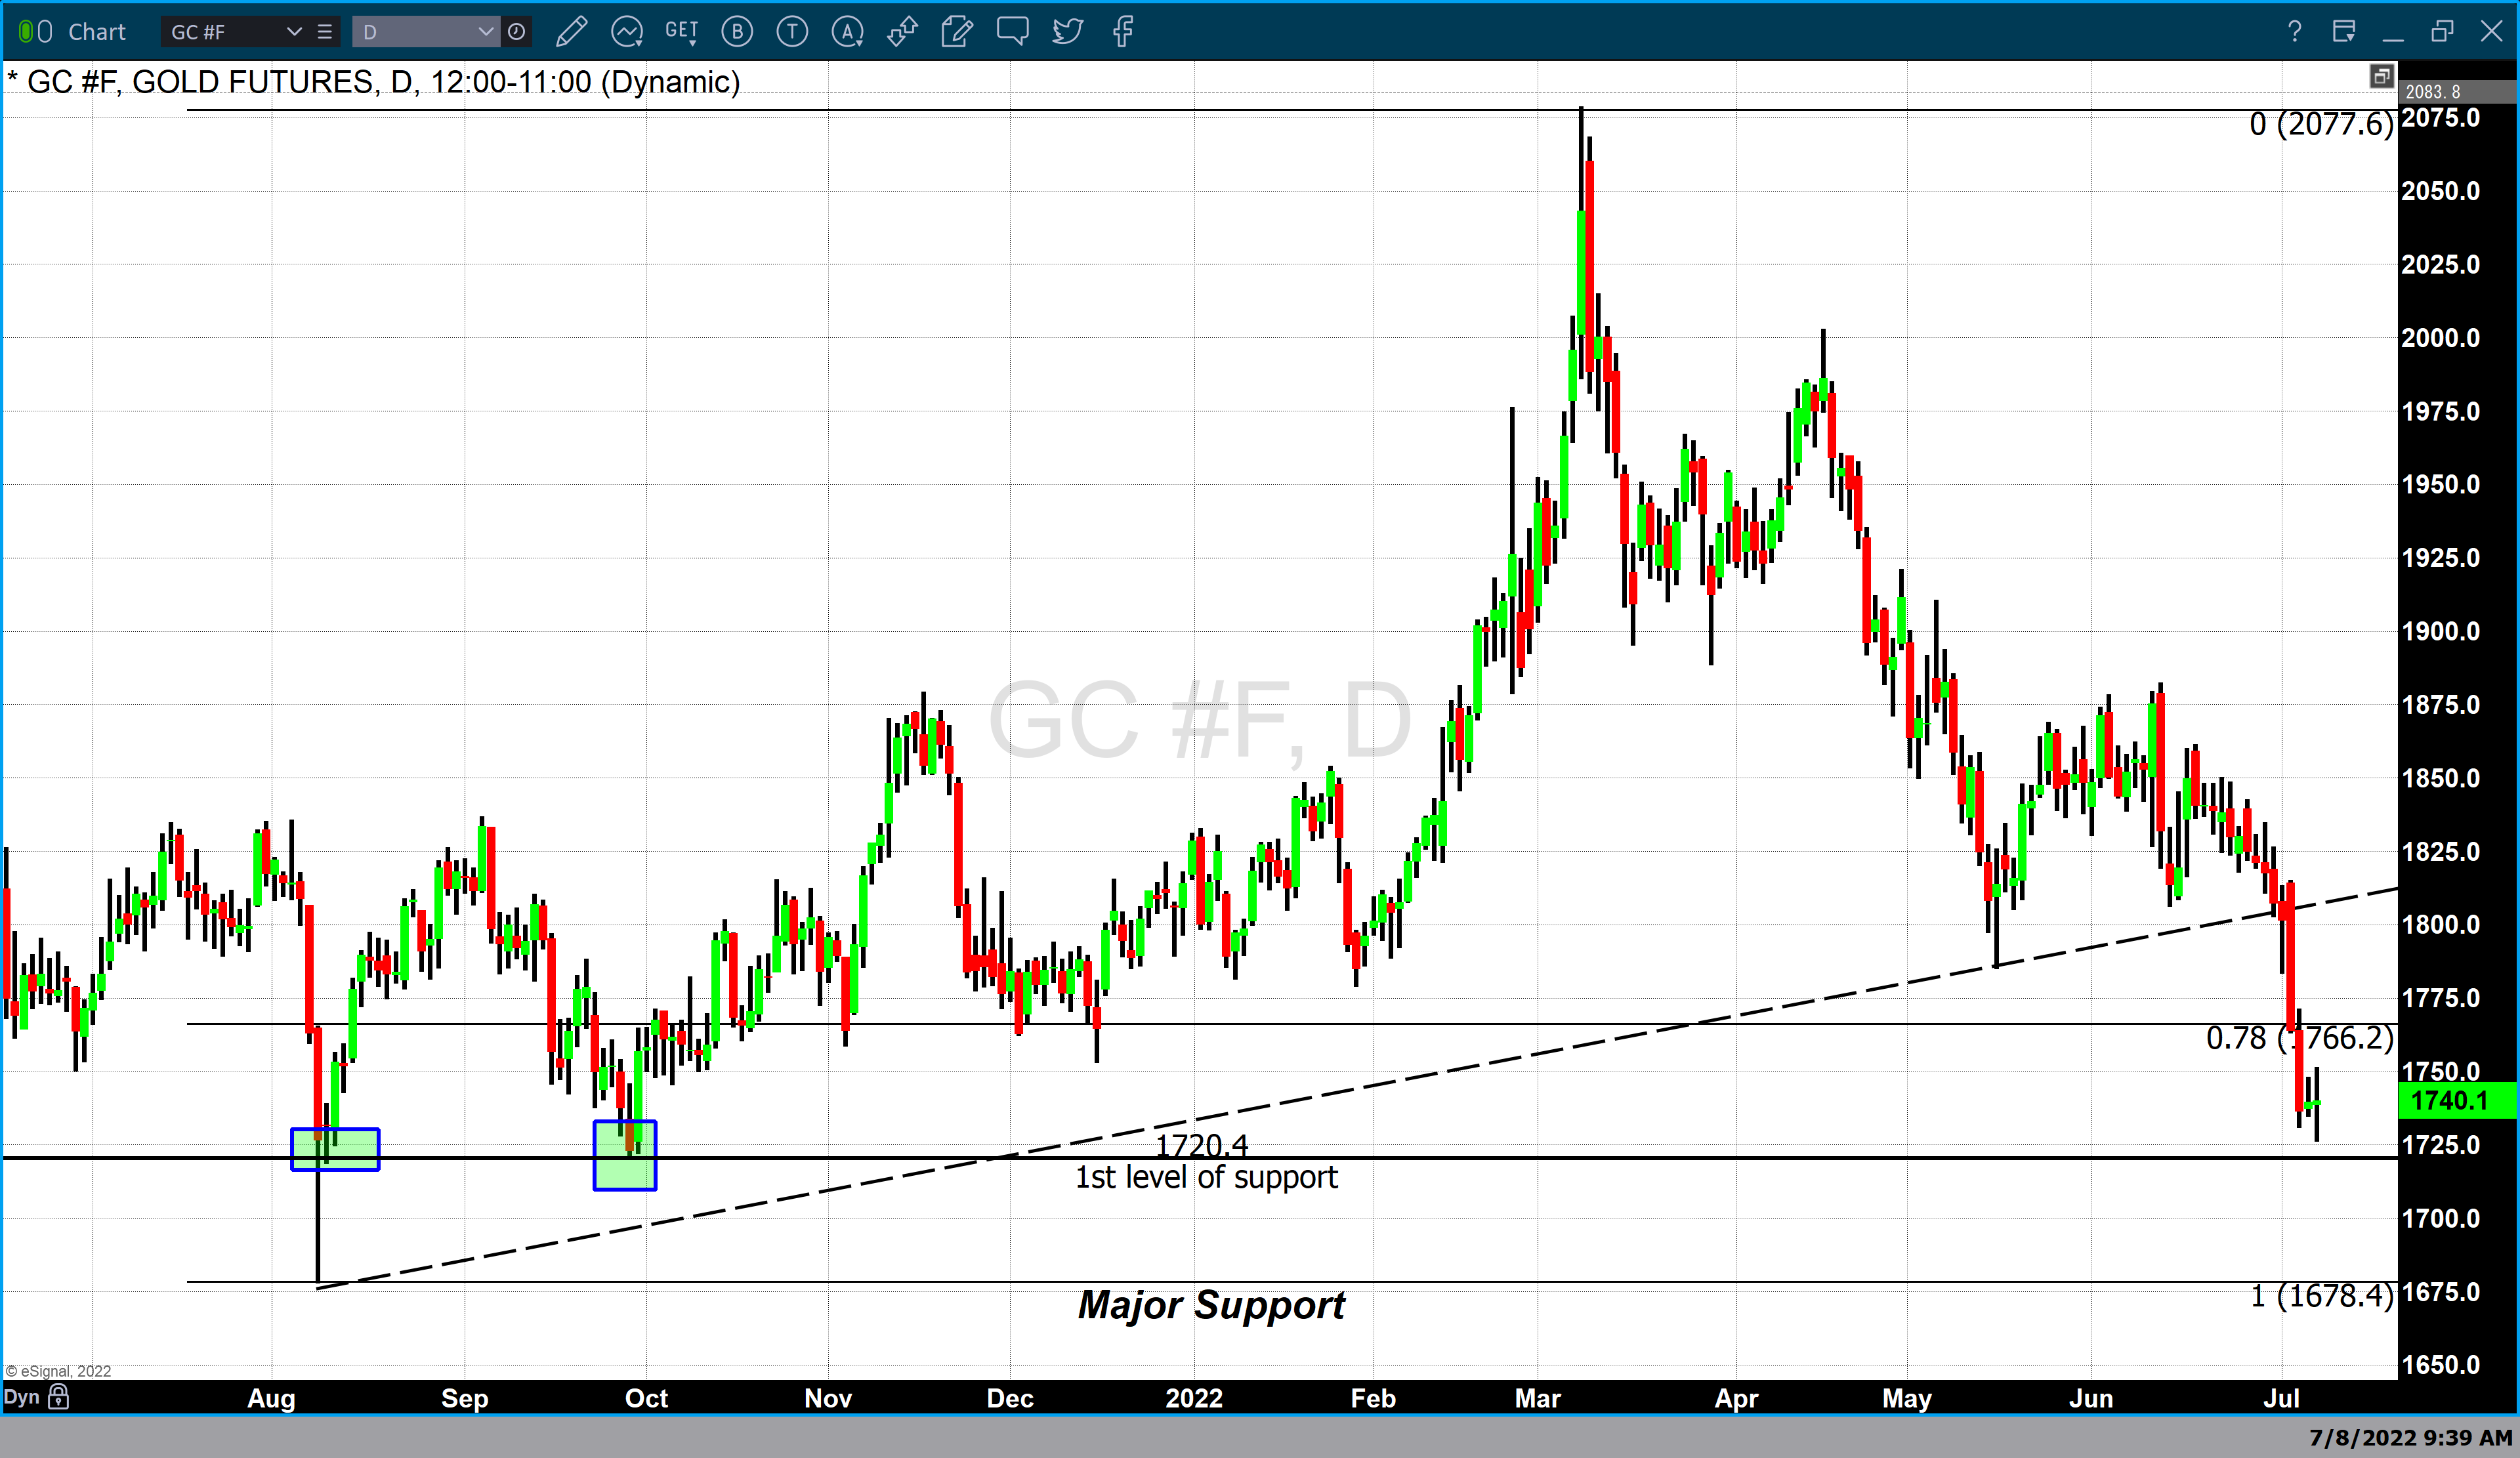
Looking at the chart below, we can see that QSR is currently trading at barely 15x FY2023 earnings estimates at a share price of $51.00, which pales in comparison to MCD at ~23x earnings and YUM at ~21x earnings.

In my view, this is completely unjustified, even if QSR’s largest brand (Burger King) is seeing a slower turnaround than planned. Even if we apply a discount and use a more conservative earnings multiple of 19.5x FY2023 earnings, I see a fair value for QSR of $66.10 per share, translating to a 30% upside from current levels.

Combined with a 2.0%+ buyback and a 4.0% dividend yield, the stock is a steal at current levels.

GDX Chart

Source: YCharts.com, FactSet, Author’s Chart

It’s easy to be bearish on the restaurant space given all the headwinds, and there are certainly many names in the casual dining space that it’s best to avoid.

However, I believe names like QSR and WING have been unfairly punished and are now trading at their most attractive valuations in years following this pullback. Therefore, I see QSR as a Buy on any dips below $50.00, and I would view any pullbacks below $83.00 on WING as buying opportunities.

Disclosure: I am long QSR

Taylor Dart
INO.com Contributor

Disclaimer: This article is the opinion of the contributor themselves. Taylor Dart is not a Registered Investment Advisor or Financial Planner. This writing is for informational purposes only. It does not constitute an offer to sell, a solicitation to buy, or a recommendation regarding any securities transaction. The information contained in this writing should not be construed as financial or investment advice on any subject matter. Taylor Dart expressly disclaims all liability in respect to actions taken based on any or all of the information in this writing. Given the volatility in the precious metals sector, position sizing is critical, so when buying small-cap precious metals stocks, position sizes should be limited to 5% or less of one's portfolio.

Market Distortion: Crude Oil vs Platinum

Market distortions appear from time to time in different instruments and sometimes it offers opportunities. I spotted one of a kind for you in the chart below.

Oil vs Platinum Chart

Source: TradingView

There is a quarter of a century of amazing correlation between crude oil futures (gray, scale A) and platinum futures (green, scale B) in the chart above. The rally and the simultaneous climax in 2008 with the following tremendous collapse into the same valley the same year are the bright spots of that strong sync.

These two instruments have been swapping the leading role as sometimes oil has been showing the path to the platinum and vice versa. The strong rebound in the past financial crisis in 2009, as well as the robust recovery in 2020 has been led by platinum futures.

The long-lasting depreciation period from 2011 till 2020 has several mis-correlation spots and overshoots in the oil price. In 2020, the two instruments have synced again as the platinum price appreciated strongly to levels unseen since 2014 and crude oil was catching up.

Last year something went wrong as the price of the metal could not progress higher after hitting the 6-year top of $1,348 in February 2021. In spite of this, the link remained strong for some time longer.

The oil price has paused its rally making the sharp zigzag in the area of the platinum price peak as if it was “inviting” the metal to continue hand in hand sky high, but in vain. This is when the divergence has started to grow and reached the ultimate gap this year.

What’s next? Possibilities that come to my mind would be a huge drop in oil price down to the $50 area to match with the current platinum level, the strong recovery of the metal’s price to around $1,600 to catch up with the oil price, or the third path would be a compromise, both instruments close the gap equally to meet in between around $75 for crude oil futures and $1,200 for platinum futures.

Every news feed tells us why oil is rising daily. What about the platinum depreciation? Let's check its fundamentals.

Platinum Supply and Demand

Source: Metals Focus, World Platinum Investment Council

In the first quarter of this year, the platinum market is in the oversupply of 167 thousand oz. Both parts of equilibrium are down, but demand dropped harder.

Platinum Demand

Source: Metals Focus, World Platinum Investment Council

Three of four main components of platinum demand have decreased, especially industrial and investment components. The automotive demand remains flat. Total demand declined 26% (-541 thousand oz.) year-on-year, which is huge and it doesn’t support the metal’s rally.

Let us check the price chart of platinum futures.

Platinum Futures Monthly

Source: TradingView

The price of platinum futures moves downwards in the second red leg within a large pullback to retest the broken resistance.

The retracement was already deep enough as it dropped below the 61.8% Fibonacci retracement level. The next support level is located at $730 (78.6% Fib). The touch point of retest is located even lower around $670. Though, the market price has more room for a further weakness.

The price shouldn’t fall below the invalidation level of $562 where the current growth point is located. The first upside barrier is too far now at $1,348 (2021 peak).

This April I called the oil price to skyrocket to $176. These days, it is not a bold projection anymore as “Global oil prices could reach a “stratospheric” $380 a barrel if US and European penalties prompt Russia to inflict retaliatory crude-output cuts”, JPMorgan Chase & Co. analysts warned.

The updated oil futures chart is below.

Oil Futures Chart

Source: TradingView

The oil price has advanced almost $30 since April, however the previous top of $130 was not touched. There is a retest of the blue uptrend channel support now and the situation could change anytime soon.

The bounce back in the uptrend could fuel the price to retest the all-time high of $147 at least. On the other hand, the breakdown could send the price into a deep pullback to the broken orange resistance around $50.

The latter is the price area where crude oil would close the gap to catch up with platinum according to the first chart above. It is an amazing coincidence of different charts.

How do you think the current divergence between crude oil and platinum will play out?

View Results

Loading ... Loading ...

High energy prices are the main driver of the current persistent inflation. Platinum is an industrial precious metal and its depreciation reflects the falling demand affected by gloomy projections of the economy and the tightening Fed. This combination could result in the stagflation (stagnation + inflation) of the economy.

Intelligent trades!

Aibek Burabayev
INO.com Contributor

Disclosure: This contributor has no positions in any stocks mentioned in this article. This article is the opinion of the contributor themselves. The above is a matter of opinion provided for general information purposes only and is not intended as investment advice. This contributor is not receiving compensation (other than from INO.com) for their opinion.

Picking the Right ETF to Avoid Contango

Exchange-traded fund investors who buy and sell inverse products regularly know what contango is. But the average investor probably doesn’t understand the ins and outs of contango and how it can hurt an investment.

With a little knowledge, you can actually use contango to your advantage and profit from an investment that is actually losing value.

What is Contango?

In a nutshell, it is the cost of purchasing futures contracts, options, and derivatives. When you invest in a leveraged exchange-traded fund, in order for the fund to gain that 2X or 3X leverage, it must buy monthly futures and options contracts.

Then towards the end of the month, the fund will sell its current contracts with very near-term expiration dates and purchase the following month's contracts that have a longer expiration date. In the process of doing this, the fund will sell a lower-priced contract and then buy a higher-priced contract.

This occurs because the further out the expiration date on an options contract, the more expensive the contract will be. This is because the buyer of the contract has time on their side and the seller is taking on more risk because the value of the underlying asset has more time to make a large move.

Since the price of the further dated contracts is always more expensive than what the fund is selling their current contracts for, the fund is constantly burning money. This money burn, is called contango. The money being ‘burned’ is literally reducing the amount of money the fund has to invest and, over time, causes the price of the ETF to slowly shrink. For example: a $25 ETF will only be worth say $20 over the course of a few months, even if the underlining investments that the fund tracks stayed absolutely the same during that whole period of time.

On a one-day basis, contango isn’t usually seen or felt by investors, but over the course of a few weeks or even months, it would definitely be felt.

How to Make Contango Work For You

One method of taking advantage of this contango money burn is too ‘short’ the different ETFs that experience this phenomenon. However, shorting stocks may not be in the cards for all investors because it is risky and capital intensive, especially when you are trying to short an investment over a long period of time.

Another, slightly lower risky way and with substantially lower capital outlays, is by purchasing put options in ETFs that experience high levels of contango. Buying put options is just slightly less risky since straight shorting a stock can actually end up costing an investor more than a 100% loss.

With put options, your max pain is 100% loss. If you short a stock and the stock runs higher, you could actually lose more than 100% of your initial investment since the stock price has no cap. Options are still risky, but again just slightly less risky.

So how does that work? Let’s say you want to short the Invesco QQQ Trust (QQQ), essentially the Nasdaq index. But you don’t want to just short it, you really believe it is heading lower so you want a little leverage.

You find the ProShares UltraPro Short QQQ ETF (SQQQ). This is an ETF that is 3X short the QQQ or the Nasdaq. The SQQQ will go higher in price when the Nasdaq goes lower. However, the SQQQ experiences contango due to the way it produces its 3 times leverage.

Now the ProShares UltraPro QQQ ETF (TQQQ) is the opposite of SQQQ. It gives investors 3X leverage to the upside of the Nasdaq or the QQQs. If you have a strong conviction that the Nasdaq is heading higher, the TQQQ is for you. But once again, contango will have an effect on your TQQQ returns if you hold it for more than one day.

Your option to not only avoid contango but also to make it work for you is to buy put options contracts in the TQQQ or the SQQQ depending on which way you think the Nasdaq is going to go.

The way these work is buying put contracts on the opposite ETF than the way they are designed to move. If you think the market is heading higher, you would normally buy the TQQQ ETF. But if you want to avoid contango, you actually buy the SQQQ put options. This is because if the market goes higher, the SQQQ will lose value and at the same time contango will be lowering the price on a daily basis just slightly.

Now if you think the Nasdaq is going lower, you would buy put options on the TQQQ, since this ETF will go higher if the market goes higher and lower if the market falls.

I am just using TQQQ and SQQQ as examples, but you can do this with any leveraged ETF that is going to experience contango. Also, you need to remember, contango will only affect an ETF's price if you are holding the ETF for a period longer than one day. And even if you hold it for just a few days, the effect will not typically be noticeable. This strategy is going to produce the best results if you plan to own the put options for a few weeks or months.

Matt Thalman
INO.com Contributor
Follow me on Twitter @mthalman5513

Disclosure: This contributor did not hold a position in any investment mentioned above at the time this blog post was published, but he does buy and sell put options in the TQQQ and SQQQ ETFs from time to time. This article is the opinion of the contributor themselves. The above is a matter of opinion provided for general information purposes only and is not intended as investment advice. This contributor is not receiving compensation (other than from INO.com) for their opinion.

Chart Spotlight: Generac Holdings (GNRC)

Every summer, power generator stocks, like Generac Holdings (GNRC) soar.

All thanks in part to hurricane season, intense heat, and the potential for blackouts. All of which increases demand for power generators from companies such as Generac Holdings.

  • In the summer of 2017, GNRC jumped from about $35 to $38
  • In the summer of 2018, GNRC jumped from about $50 to $56
  • In the summer of 2019, GNRC jumped from about $57 to $75
  • In the summer of 2020, GNRC jumped from about $112 to $191
  • In the summer of 2021, GNRC jumped from about $319 to $420

Even better, three out of the last four monthly MarketClub Trade Triangle signals highlighted a positive move for the stock.

The last monthly green Trade Triangle was issued at $118.86 on May 26, 2020 and pointed to a move higher all the way to the red monthly Trade Triangle at $391.85 on December 3, 2021.

GNRC Chart with Monthly Trade Triangles

Source: MarketClub

While summer 2022 hasn’t started off well for the GNRC, or for any stock out there, it is currently oversold. From a current price of $222.23, I’d like to see the GNRC stock challenge $300 a share again, near-term.

For one, the oversold generator stock could benefit as “demand for uninterrupted and reliable power supply has increased significantly, which has led to the sale of generators. Therefore, generators are considered a robust medium in providing power backup in industrial buildings, data centers, and at times in emergencies,” as noted by Astute Analytica. 

Two, according to TheFly.com: Northland analyst Donovan Schafer said Spruce Point's short report on Generac issued on June 22 "pedantically focuses on immaterial issues" and was "deeply-flawed." He maintains an Outperform rating and $370 price target on Generac shares.

Three, The Wall Street Journal says, “From California to Texas to Indiana, electric-grid operators are warning that power-generating capacity is struggling to keep up with demand, a gap that could lead to rolling blackouts during heat waves or other peak periods as soon as this year.”

Even the Electric Reliability Council of Texas (ERCOT), which operates Texas’ electric power grid, is asking households and businesses to conserve power, warning of rolling blackouts. The grid faces a “potential reserve capacity shortage with no market solution available,” ERCOT said.

Four, analysts at Wells Fargo just initiated coverage of the GNRC stock with an overweight rating, with a price target of $285. The firm believes Generac Holdings is a play on the instability of the current grid.

With that in mind, I believe shares of Generac Holdings (GNRC) could rocket higher. Again, from a current price of $222.23, I’d like to see GNRC stock at $300 a share again, near-term.

Ian Cooper
INO.com Contributor

Disclosure: This contributor did not hold a position in any investment mentioned above at the time this blog post was published. This article is the opinion of the contributor themselves. The above is a matter of opinion provided for general information purposes only and is not intended as investment advice. This contributor is not receiving compensation (other than from INO.com) for their opinion.

Will Rate Hikes Lead to Recession?

Although trading last week was limited to four trading days due to a holiday weekend gold had a deep and severe price decline.

Gold lost approximately $74 in trading this week opening at approximately $1814 on Tuesday and settling at $1741 Wednesday. Last week’s price decline resulted in gold devaluing by 4%.

The Friday before last, gold opened above and closed below a support trendline that was created from two higher lows. The first low occurs at $1679 the intraday low of the flash crash that occurred in mid-August 2021. The second low used for this trendline occurred in the middle of May when gold bottomed at $1787.

Daily Gold Futures Chart

Gold closed just below that trendline one week ago, however it was Tuesday's exceedingly strong price decline of $50 that accounted for two-thirds of last week’s price decline and resulted in major technical chart damage.

Daily DX Futures Chart

The primary force that moved gold substantially lower last week was dollar strength. The dollar index gained well over 2% last week accounting for over half of the price decline in gold.

Dollar strength was a result of traders and investors focusing on recent and future interest rate hikes by the Federal Reserve. Since March the Federal Reserve has raised rates on three occasions with each rate hike having a higher percentage increase than the last. The Fed raised rates by 25 basis points in March, 50 basis points in May, and 75 basis points in June.

Friday’s jobs report was forecasted to show that 250,000 jobs were added to payrolls last month. The actual numbers came in well above expectations with 327,000 jobs added last month. The unemployment level remained at 3.6%.

The fact that the actual jobs report came in above expectations strengthened the hand of the Federal Reserve to continue to raise interest rates substantially this month.

It is highly anticipated that the Federal Reserve will enact another 75-point rate hike at the July FOMC meeting. Before the Federal Reserve raised interest rates in March the fed funds rate was just ¼% or 25 basis points.

Currently, the interest rate set by the Federal Reserve is at 1 ½ % to 1 ¾. This would take the interest level set by the Federal Reserve to 2 ¼% to 2 ½%.

According to the CME’s FedWatch tool, there is a 93% probability that the Federal Reserve will raise rates once again by 75 basis points this month.

However, there are three more times that members of the Federal Reserve will convene for an open market committee meeting which leaves the door open for additional rate hikes. Because the Federal Reserve is data-dependent the number and size of the rate hikes will be based upon whether or not there is a substantial decrease in inflationary pressures.

That being said, it is most likely that this week’s CPI report will not have a dramatic impact on the Federal Reserve’s decision to raise rates as Chairman Powell and other Fed members have stated that the Federal Reserve will aggressively raise rates at the July FOMC meeting.

For those who would like more information simply use this link.

Wishing you, as always good trading,
Gary S. Wagner
The Gold Forecast