Market distortions appear from time to time in different instruments and sometimes it offers opportunities. I spotted one of a kind for you in the chart below.
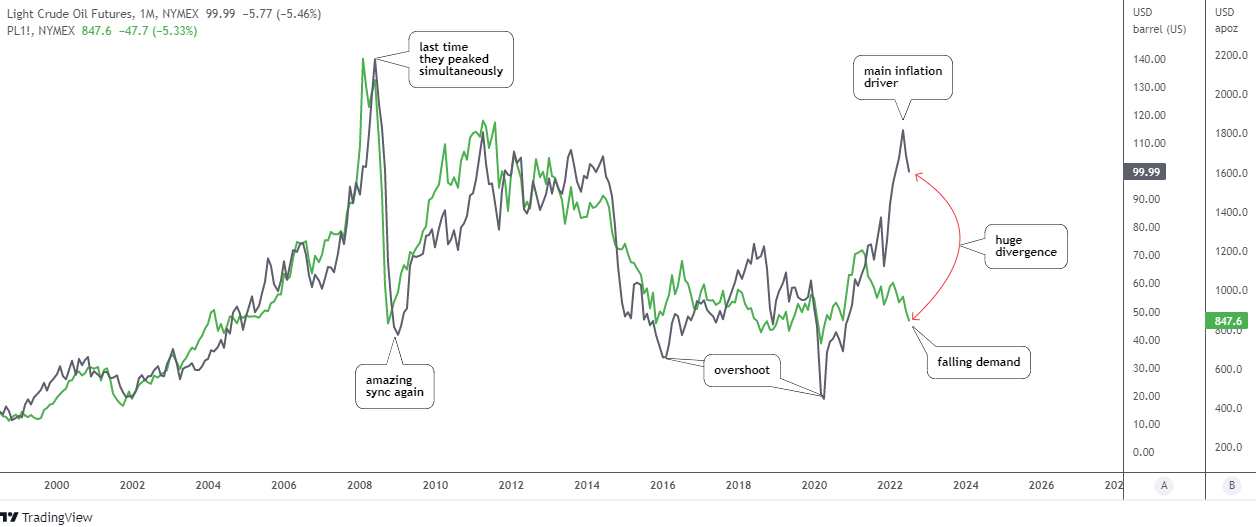
There is a quarter of a century of amazing correlation between crude oil futures (gray, scale A) and platinum futures (green, scale B) in the chart above. The rally and the simultaneous climax in 2008 with the following tremendous collapse into the same valley the same year are the bright spots of that strong sync.
These two instruments have been swapping the leading role as sometimes oil has been showing the path to the platinum and vice versa. The strong rebound in the past financial crisis in 2009, as well as the robust recovery in 2020 has been led by platinum futures.
The long-lasting depreciation period from 2011 till 2020 has several mis-correlation spots and overshoots in the oil price. In 2020, the two instruments have synced again as the platinum price appreciated strongly to levels unseen since 2014 and crude oil was catching up.
Last year something went wrong as the price of the metal could not progress higher after hitting the 6-year top of $1,348 in February 2021. In spite of this, the link remained strong for some time longer.
The oil price has paused its rally making the sharp zigzag in the area of the platinum price peak as if it was “inviting” the metal to continue hand in hand sky high, but in vain. This is when the divergence has started to grow and reached the ultimate gap this year.
What’s next? Possibilities that come to my mind would be a huge drop in oil price down to the $50 area to match with the current platinum level, the strong recovery of the metal’s price to around $1,600 to catch up with the oil price, or the third path would be a compromise, both instruments close the gap equally to meet in between around $75 for crude oil futures and $1,200 for platinum futures.
Every news feed tells us why oil is rising daily. What about the platinum depreciation? Let's check its fundamentals.
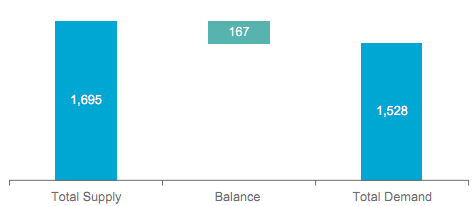
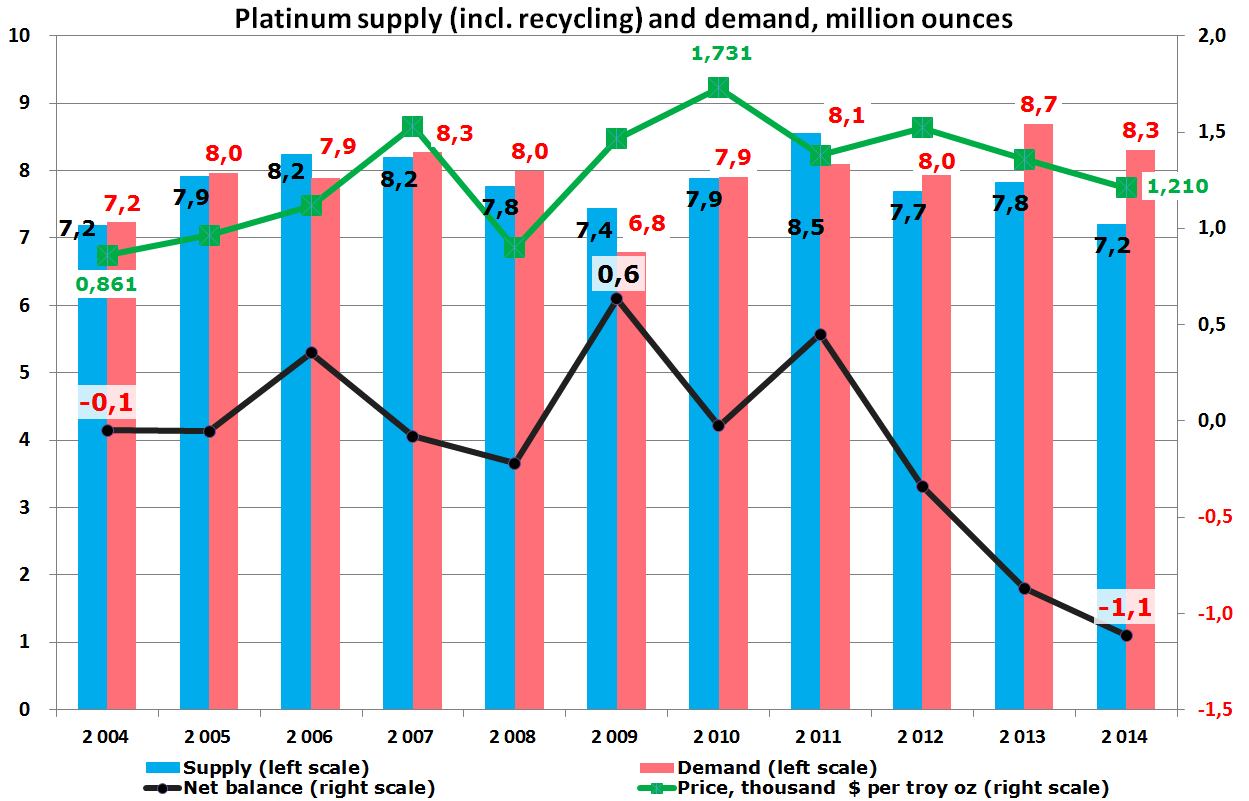
In the first quarter of this year, the platinum market is in the oversupply of 167 thousand oz. Both parts of equilibrium are down, but demand dropped harder.
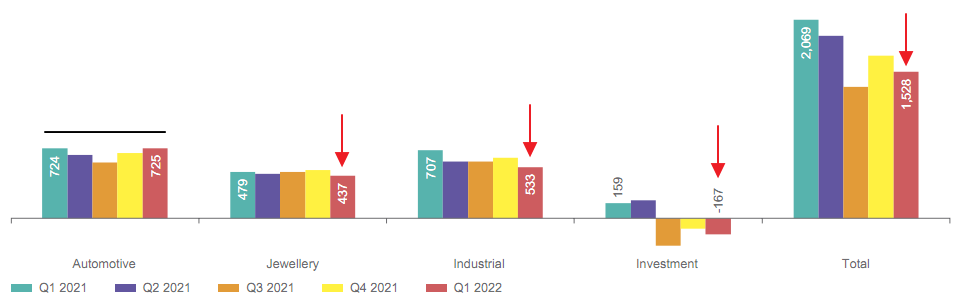
Three of four main components of platinum demand have decreased, especially industrial and investment components. The automotive demand remains flat. Total demand declined 26% (-541 thousand oz.) year-on-year, which is huge and it doesn’t support the metal’s rally.
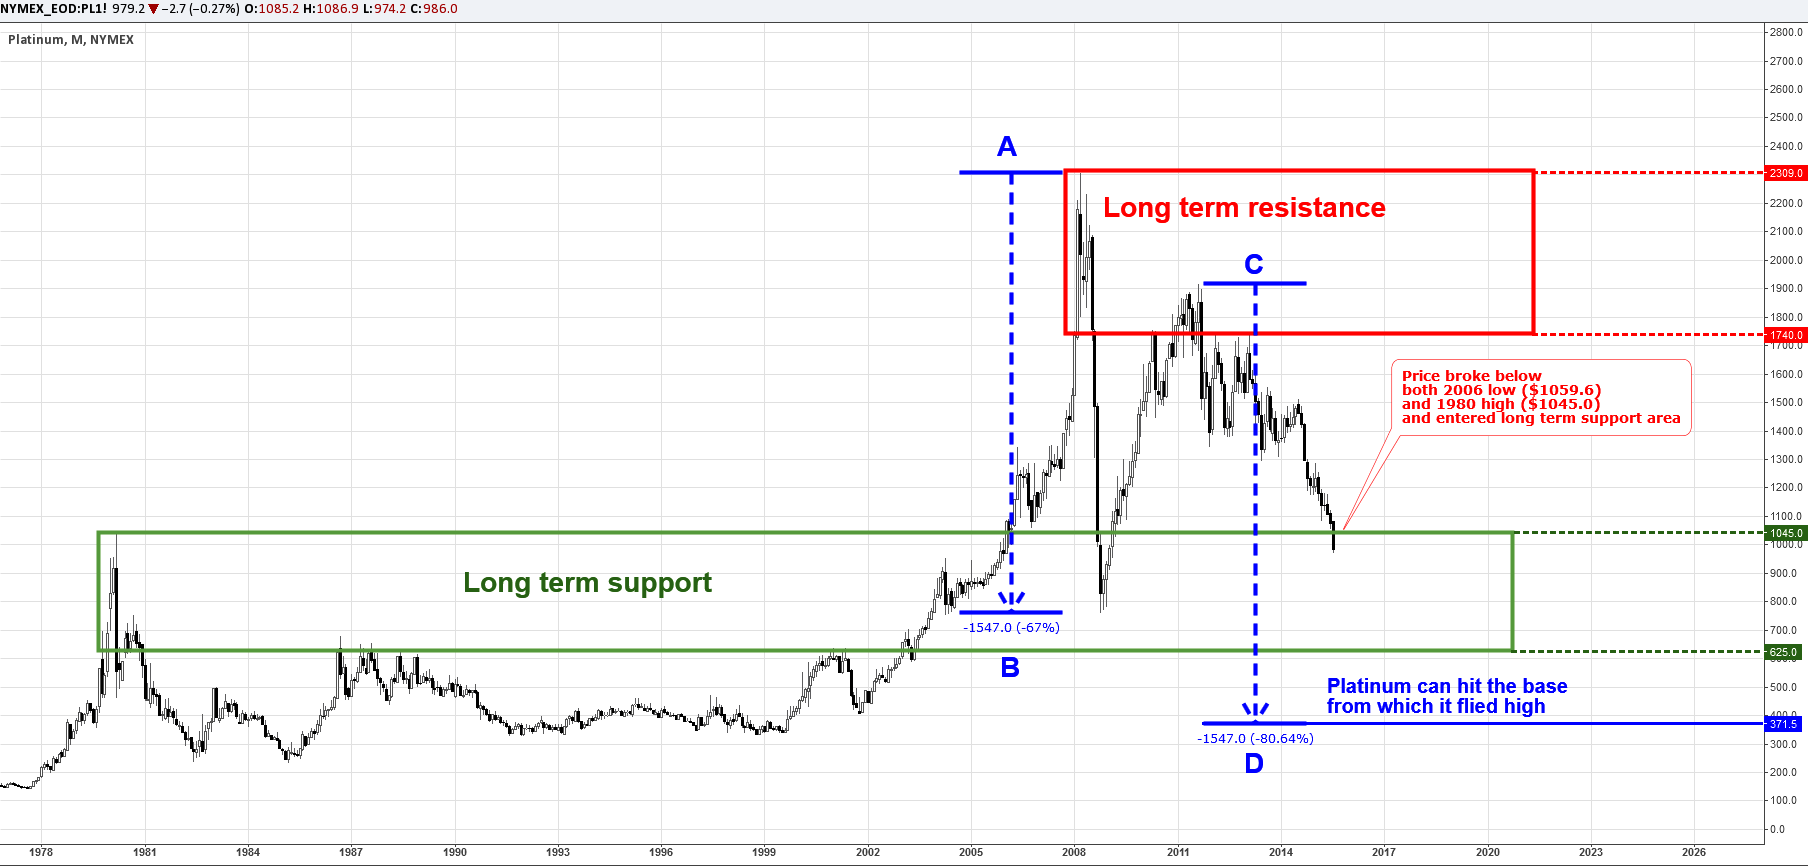
Let us check the price chart of platinum futures.
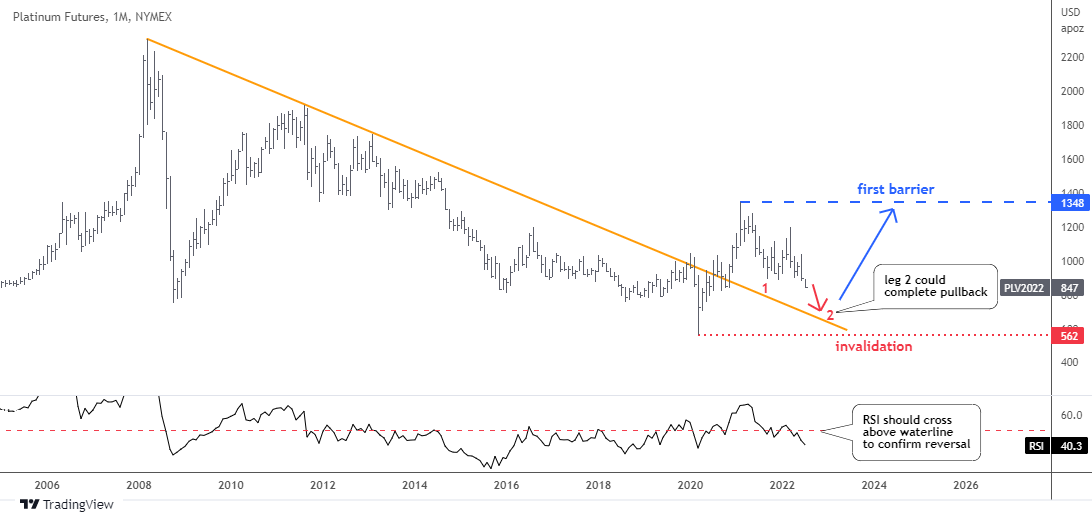
The price of platinum futures moves downwards in the second red leg within a large pullback to retest the broken resistance.
The retracement was already deep enough as it dropped below the 61.8% Fibonacci retracement level. The next support level is located at $730 (78.6% Fib). The touch point of retest is located even lower around $670. Though, the market price has more room for a further weakness.
The price shouldn’t fall below the invalidation level of $562 where the current growth point is located. The first upside barrier is too far now at $1,348 (2021 peak).
This April I called the oil price to skyrocket to $176. These days, it is not a bold projection anymore as “Global oil prices could reach a “stratospheric” $380 a barrel if US and European penalties prompt Russia to inflict retaliatory crude-output cuts”, JPMorgan Chase & Co. analysts warned.
The updated oil futures chart is below.
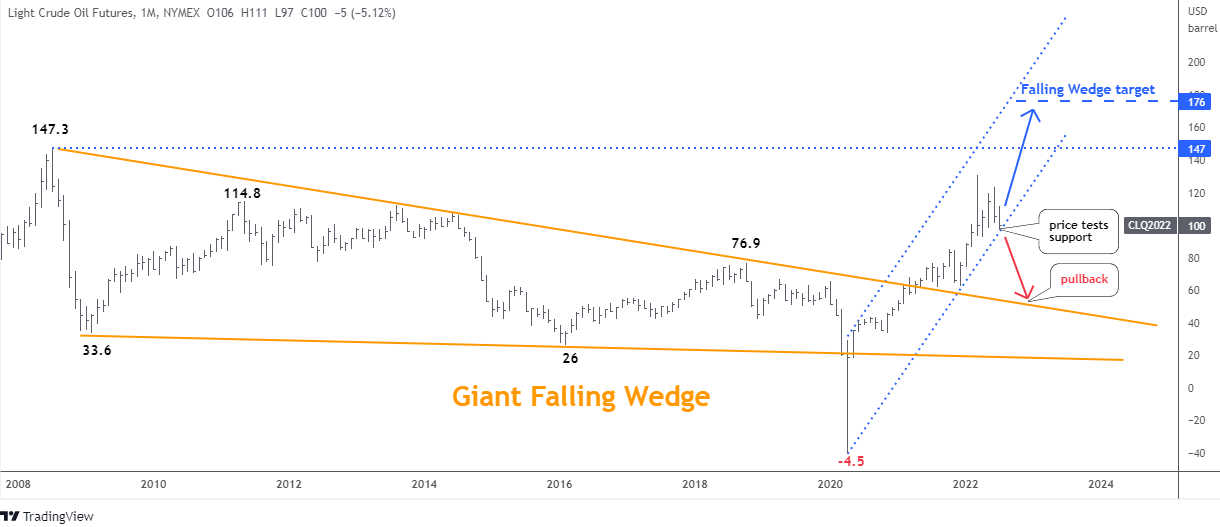
The oil price has advanced almost $30 since April, however the previous top of $130 was not touched. There is a retest of the blue uptrend channel support now and the situation could change anytime soon.
The bounce back in the uptrend could fuel the price to retest the all-time high of $147 at least. On the other hand, the breakdown could send the price into a deep pullback to the broken orange resistance around $50.
The latter is the price area where crude oil would close the gap to catch up with platinum according to the first chart above. It is an amazing coincidence of different charts.
High energy prices are the main driver of the current persistent inflation. Platinum is an industrial precious metal and its depreciation reflects the falling demand affected by gloomy projections of the economy and the tightening Fed. This combination could result in the stagflation (stagnation + inflation) of the economy.
Intelligent trades!
Aibek Burabayev
INO.com Contributor
Disclosure: This contributor has no positions in any stocks mentioned in this article. This article is the opinion of the contributor themselves. The above is a matter of opinion provided for general information purposes only and is not intended as investment advice. This contributor is not receiving compensation (other than from INO.com) for their opinion.