3 Banks Stocks That You Should Be On Your Radar

Hello traders and MarketClub members everywhere! Today, I'm going to look at three banking stocks that flashed buy alerts last Friday. Recently, the bank stocks have been on a tear. For the past two years, they have all been moving higher, but now they seem to have begun an accelerated phase to the upside which could be their last move.

The stocks I'll be looking at today are JP Morgan Chase & Co. (NYSE:JPM), The Goldman Sachs Group (NYSE:GS) and U.S. Bank Corp (NYSE:USB). Each of these three stocks gave a Trade Triangle signal last Friday that the intermediate trend had once again resumed. Continue reading "3 Banks Stocks That You Should Be On Your Radar"

Gold Futures Rise Above $1,200 as Demand for the Metal Rises

By: FX Empire

After an early-session steep decline, Comex gold futures are now trading significantly higher. The early session sell-off was in response to trader reactions to the failure of the Swiss referendum to increase Swiss National Bank gold reserves; although the vote to not increase the reserves from 7% to 20% was anticipated, the market still dove nearly 2% as a result.

"We didn't think that vote was going to pass. Nobody thought that, but they've cleared the air," explained George Gero of RBC. He continued on to say that what brought gold back was the fact that there are three continents that have to stimulate their economies. The market was being pulled by buyers who are bargain hunters wanting to take advantage of the plunge in the price of gold, and then it was pushed back again by the dollar, as well as by deflation.

Comex gold futures for February hit $1,221 per ounce and then settled with a gain of 3.6% to $1,281. This has been the biggest swing since April of 2013. Continue reading "Gold Futures Rise Above $1,200 as Demand for the Metal Rises"

Mr. Draghi Fails To Deliver

George Yacik - INO.com Contributor - Fed & Interest Rates


Mario Draghi may have cried wolf one too many times.

I've watched with amazement over the past couple of years as the European Central Bank president has gotten more mileage from saying what he intends or plans to do in the future – without actually having to do it – yet nearly always gets the financial markets to do what he wants them to do.

But, it looks like he ran out of luck on Thursday when he announced at his regular press conference after the ECB's monthly meeting that the bank was going to put off until "early next year" any new measures to try to stimulate the moribund Eurozone economy.

Not surprisingly, the euro surged, sovereign bond yields rose and stock prices plummeted after Draghi’s disappointing remarks. The euro jumped over a penny, or more than 1%, against the dollar while yields on Italian and Spanish 10-year government bonds rose about four basis points. In recent weeks, yields on Eurozone sovereign bonds have dropped to their lowest levels on record on speculation that the ECB would soon start buying up those bonds, as well as those of other countries.

Before the meeting, it had been widely expected that Draghi would announce the ECB will start buying government, and possibly corporate bonds too, to try to boost inflation in the zone. So far it has bought covered bonds and other asset-backed securities, with little in the way of economic improvement to show for it. Indeed, at the ECB's previous meeting in early November, Draghi said the bank would take further steps to increase its balance sheet in order to boost the currency zone's economy, which many took to mean government bond purchases were next on the agenda. Continue reading "Mr. Draghi Fails To Deliver"

Abenomics: From Faith to Failure

Why the biggest monetary stimulus effort in the world did NOT stop deflation in its tracks

By Elliott Wave International

When Shinzo Abe became the Prime Minister of Japan in December 2012, he was regarded with the kind of reverence that politicians dream about. He was featured in a hit pop song ("Abeno Mix"), hailed as a "samurai warrior," and featured on the May 2013 The Economist cover as none other than Superman.

But in the two short years since, Abe as Superman has been struck down by the superpower-zapping force of economic kryptonite. On November 17, government reports confirmed that Japan's brief respite from a 20-year long entrenched deflation was over as the nation's 2nd & 3rd quarter GDP shrank 7.2% and 1.6% respectively.

In the words of a November 20, 2014 New York Times article: Continue reading "Abenomics: From Faith to Failure"

Will Silver Drop To $4-5/oz?

Aibek Burabayev - INO.com Contributor - Metals

Gold Chart Analysis

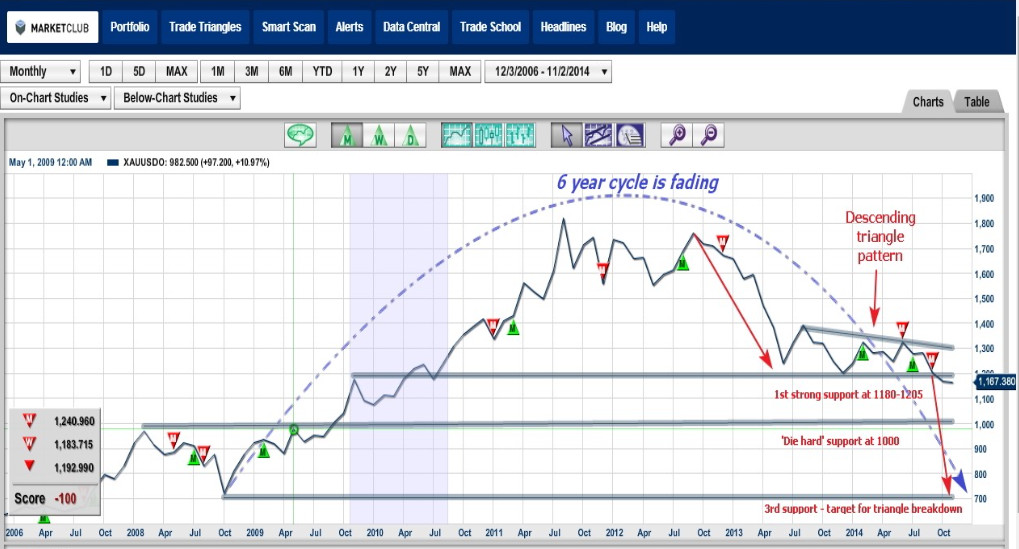
On a monthly chart of gold (FOREX_XAUUSDO), the 6 year cycle has entered the final period after the price peaked in 2011 at $1823 close. A descending continuation triangle pattern has been formed. This suggests that the price will proceed in a downward movement.

This line chart shows monthly market closes and it clearly indicates that the triangle's base was broken at the $1180-$1205 level. The price, already for two consecutive months, managed to close below first support. This signal confirms the pattern.

The target is calculated as the distance of the trend before the Triangle was formed, from the peak in August 2012 close at $1764/oz to the low of May 2013 close at $1243/oz, and projected below the triangle's base. I calculated $700/oz level as the target for our move with simple approximation, which coincides with the 6 year cycle's start or base level. This gives more weight to the power of this level.

There is very tough support between $1200 and $700 levels located at $1000/oz. Firstly, it's an important psychological level and secondly, it is a former stiff resistance which was broken only from a 4th attempt in 2009. Only this level can be a serious obstacle on the way down.

Although we see a clear bearish trend, we can't rule out a pattern breakout or total reversal of the trend.

On the upside, the first good resistance is at the $1300 level which is the triangle's upper side, the second good resistance is $1400 – the triangle's first peak.

Gold 1


Silver Chart Analysis

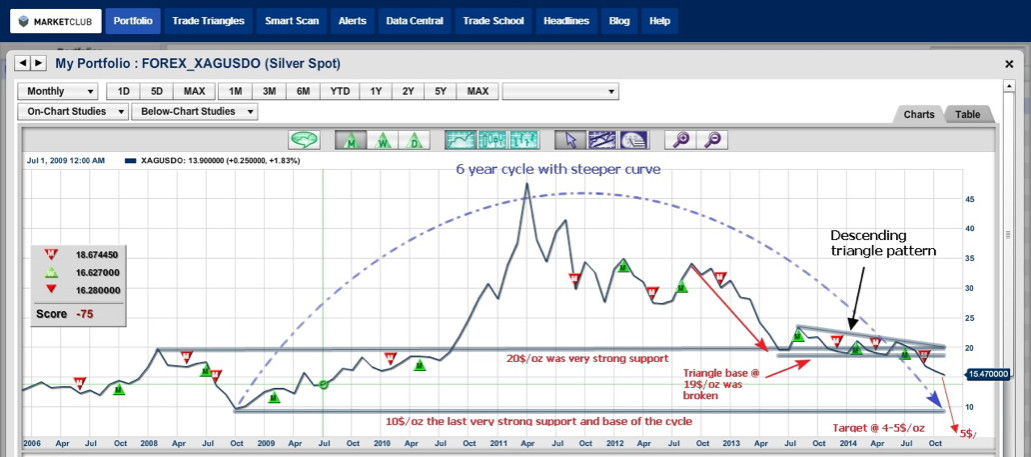
Let's move onto silver (FOREX_XAGUSDO). Like the previous chart of gold, we see a 6 year fading cycle, but the curve is steeper for silver. And of course, you can see that silver dropped far deeper than the gold. If gold dropped around 40% from it's all time high in 2011, then silver plummeted an impressive 70%! Since silver is less liquid, that would explain its volatility. Silver's price action is a good indicator for gold's future moves. Keep that in mind while you search for trading opportunities.

This metal broke all major supports, including the very important level at $20/oz, which is a former resistance level that couldn't be broken for 3 years in a row. Next was the triangle's base at $19/oz. After it was passed, the price quickly fell to new lows at $15/oz. The target was calculated in the same manner as it was calculated for gold, at $4-5/oz to the downside. I would be very cautious once the price reaches $10/oz. Anywhere a two-digit number turns into a one-digit number is an area of prime psychological importance.


Price can start to be volatile between the $10 and $20 levels, which then acts as resistance for a possible price pullback.

After $20, the next good resistance is located at the $24-$35 level, which is the peak of the triangle.

Silver Analysis


Visit back for my metals analysis next week.

Lucky trades,

Aibek Burabayev
INO.com Contributor, Metals

Disclosure: This contributor has no positions in any stocks mentioned in this article. This article is the opinion of the contributor themselves. The above is a matter of opinion provided for general information purposes only and is not intended as investment advice. This contributor is not receiving compensation (other than from INO.com) for their opinion.