Is Twitch a game changer for Amazon.com Inc. (NASDAQ:AMZN)?

If you're not familiar with Twitch, it is a video game playing business that attracts 55 million unique viewers a month. That's enough viewers to put it among the 15 most heavily trafficked websites in the world.

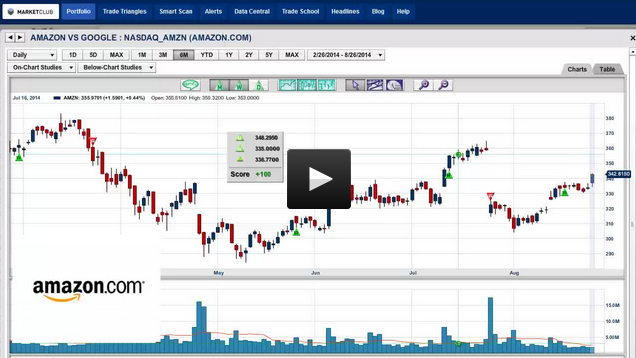
So what exactly is Twitch and why did Amazon.com Inc. (NASDAQ:AMZN) shell out close to $1 billion to buy this company? Here is my take, young men's eyeballs. Young men are some of the hardest demographics to track for advertisers. The combination of Amazon and Twitch could be a killer combination for Amazon to sell products to this particular demographic.

So how does Twitch make money? The company shares its advertising revenue with people who broadcast over its service. While the audiences for some broadcasters are so small they make little money, on the other side of the coin, some broadcasters are said to earn over six figures a year. Continue reading "Is Twitch a game changer for Amazon.com Inc. (NASDAQ:AMZN)?"

Major Bearish Trend Change Overseas May Spell Trouble for U.S. Market

By: John Kosar of Street Authority

All major U.S. indices closed higher for the third consecutive week, led by the Dow Jones Industrial Average, which was up 2%. Year to date, by far the strongest major index has been the tech-heavy Nasdaq 100 (NDX), which is up 12.8%. This leadership by technology has been a key catalyst in the 2014 broad market advance, helping the SP 500 post a 7.6% gain despite a weak small cap sector. This strength in tech must continue to keep the broader market headed higher.

From a sector standpoint, last week's advance was led by financials, industrials and consumer discretionary, but all sectors of the SP 500 ended in positive territory.

Key Indices Held Major Support Levels in August

Many key indices, including the SP 500, Dow Jones Industrial Average and PHLX Semiconductor Index, have rebounded nicely from major support levels that were tested during the first week of August, and finished last week at or near their 2014 highs.

The SPDR Dow Jones Industrial Average (NYSE: DIA), which I first mentioned as a potential buying opportunity in the May 12 Market Outlook, closed out last week 3.7% above its Aug. 7 test of its 200-day moving average, a widely watched major trend proxy, and less than 1% below its July 17 all-time high of $171.32.

Although I remain cautiously positive on DIA heading into this week, I am still apprehensive about its more intermediate-term sustainability due to frothy investor sentiment, weak August-to-September seasonality, and major overhead resistance in the market-leading Nasdaq 100. Continue reading "Major Bearish Trend Change Overseas May Spell Trouble for U.S. Market"

Trade Triangles Catch The Move In Burger King

Hello traders everywhere! The Trade Triangles catch the move in a stock that's in the news today, Burger King Worldwide, Inc. (NYSE:BKW).

MarketClub's Trade Triangles indicated 10 days ago that this stock was in a strong uptrend and headed higher with new green weekly Trade Triangle and a score of +100.

The weekly Trade Triangle was triggered on August 15th at $26.97 for Burger King Worldwide, Inc. (NYSE:BKW). I'll show you how this approach can help you successfully trade stocks. Still have doubts? Then watch today's video.

It will be interesting to see how this plays out in the future with other companies who decide to go North of the border. As always, I'll be watching our Trade Triangles for signs of a change in trend.

I would love to hear what you think of Burger King Worldwide, Inc. (NYSE:BKW), and what you think of this company moving to Canada because of tax considerations.

Every success using MarketClub,
Adam Hewison
President, INO.com
Co-Creator, MarketClub

Deflationary Straw Man

No matter the debates over inflation vs. deflation, increasing employment vs. sound monetary policy or systemic health vs. fragility (and whatever else is flying around in Jackson Hole this week), the CPI marches onward and upward.  That is the system and it is predicated on creating enough money out of thin air while inflation signals are (somehow) held at bay.

The Straw Man* in this argument lives in the idea that inflation is not always destructive, that inflation can be used for good and honed, massaged and targeted just right to achieve positive ends to defeat the curse of deflation that is surely just around the next corner.  Currently, the Straw Man is supported by the reality of the moment, which includes long-term Treasury yields remaining in their long-term secular down trend.

Indeed, right here at this very site was displayed much doubt about the promotion having to do with the “Great Rotation” out of bonds and into stocks (i.e. that the yield would break the red dotted EMA 100 this time).  We noted it right at that last red arrow on the Continuum© below.  Now, with commodity indexes right at critical support and precious metals not far from their own, the time is now if a match is going to be put to that dry old Straw Man and silver is going to out perform gold, inflation expectations barometers (TIPS vs. unprotected T bonds) are going to turn up and the Continuum is going to find support.


tyx

People argue over inflation’s effects and the expectations thereof but the CPI, which is the ultimate measure of inflation’s lagging effects, has never stopped to take a breather.  2008′s liquidation of the system?  Child’s play.  Inflation, which is what the Fed has been hysterically promoting since 2007, will always manifest in rising prices somewhere.  As luck would have it, this time it is manifesting in the stock market to a greater degree than the CPI.  ‘All good!’ think our policy makers if the right prices are rising. Continue reading "Deflationary Straw Man"

Weekly Futures Recap With Mike Seery

We've asked Michael Seery of SEERYFUTURES.COM to give our INO readers a weekly recap of the Futures market. He has been Senior Analyst for close to 15 years and has extensive knowledge of all of the commodity and option markets.

Michael frequently appears on multiple business networks including Bloomberg news, Fox Business, CNBC Worldwide, CNN Business, and Bloomberg TV. He is also a guest on First Business, which is a national and internationally syndicated business show.

Crude Oil Futures

Crude oil futures in the October contract down are $.30 this Friday afternoon currently trading at $93.60 a barrel finishing down about $1.50 for the trading week and I’m still recommending a short position in crude oil placing your stop above the 10 day high which on Monday’s trade will be at 97.10 risking around $4 or $4,000 per contract as the trend seems to be getting stronger to the downside as the U.S dollar is pressuring commodity prices hitting an 11 month high against the Euro currency this afternoon. The chart structure in crude oil will improve dramatically in the next several days so be patient as prices are still trading below their 20 and 100 day moving average dropping around $12 in the last 3 months as world supplies are extremely large at the current time and my theory states that the United States government wants to hurt Russia and the one way to hurt Russia’s economy is by pressuring oil prices as Russia’s economy is basically based on high energy prices so continue to play this to the downside as I think we will crack $90 a barrel in the next couple of weeks.
TREND: LOWER
CHART STRUCTURE: IMPROVING
Continue reading "Weekly Futures Recap With Mike Seery"