Chart to Watch - Corn Futures (CBOT:ZC.H14.E)

We've asked our friend Jim Robinson of profittrading.com to provide his expert analysis of charts to our readers. Each week he'll be analyzing a different chart using the Trade Triangles and his experience.

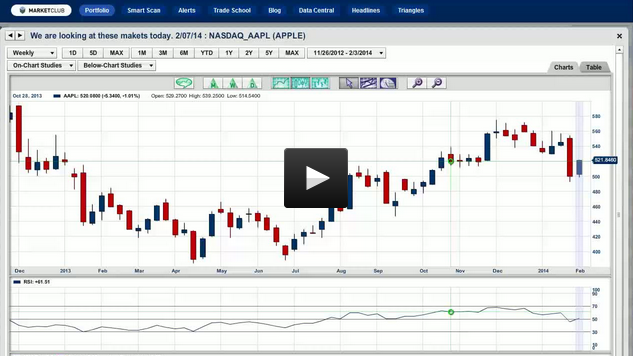
Today he is going to take a look at the technical picture of the March Corn Futures (CBOT:ZC.H14.E).

When trading futures with the MarketClub system you use the weekly Trade Triangles to tell trend and the daily Trade Triangles to time the trades.

With the trend up right now in Corn, you can buy on all new green daily Trade Triangles as long as the weekly Trade Triangle stays green.

With the growing season for March Corn Futures (CBOT:ZC.H14.E). just around the corner, there can be a number of weather scares, from too much rain, to not enough rain, any of which can drive the price of Corn higher.

Right now there looks to be great upside potential in Corn making this an excellent Chart to Watch!

Thanks,
Jim Robinson
Profit Trading.com

Many Are Betting on a Calm Market. We're Not.

Here's one good reason why: a historic market sentiment extreme

By Elliott Wave International

The DJIA, S&P and NASDAQ are struggling to bounce. Yet the bullish convictions remain high. Says a February 5 Investor's Business Daily headline:

"Why Mutual Fund Investors Need Not Panic After January Sell-Off"

When is the best time to get out of the stock market? When everyone else is invested and extremely optimistic. When is the best time to buy, then? Exactly: when you see the opposite sentiment.

Market sentiment is one indicator you don't hear much about on financial networks. Yet we've seen sentiment extremes repeat at every recent market top and bottom. What's more, as Robert Prechter, the president of Elliott Wave International, puts it, "the greater the degree of the advance that is ending, the greater the optimism at its peak."

This contrarian view of the market can be a financial lifesaver.

Below is an excerpt from Prechter's recent Elliott Wave Theorist, a monthly newsletter he has published since 1978. It shows you one way how Bob finds bearish and bullish extremes in the market. Continue reading "Many Are Betting on a Calm Market. We're Not."

Weekly Futures Recap With Mike Seery

We’ve asked Michael Seery of SEERYFUTURES.COM to give our INO readers a weekly recap of the Futures market. He has been Senior Analyst for close to 15 years and has extensive knowledge of all of the commodity and option markets.

Michael frequently appears on multiple business networks including Bloomberg news, Fox Business, CNBC Worldwide, CNN Business, and Bloomberg TV. He is also a guest on First Business, which is a national and internationally syndicated business show.

Gold Futures

Gold futures in the April contract are trading above their 20 day but below their 100 day moving average which is pretty close at 1,275 going out this Friday afternoon in New York at 1,267 up about $10 after closing last Friday at 1,240 having one of its best trading weeks in quite some time. The next major resistance in gold is at 1,280 and if that level is broken I believe a bull market is underway as the gold market looks like it's finally bottomed entering new 2 month highs as the trend line has now been broken as prices are starting to climb higher. I have not been particularly bullish gold for quite some time but things have changed and this is the most bullish I've been as I love the chart pattern on the daily chart and I think prices have bottomed so if you're looking to take a shot to the upside my suggestion would be to buy a mini contract at today's price placing a stop below the contract low of 1,180 risking around $$2,600 as today's monthly unemployment number was very disappointing once again sending investors into treasury bonds and gold and I do believe gold prices are headed higher. Continue reading "Weekly Futures Recap With Mike Seery"

Is This A Dead Cat Bounce?

Hello traders everywhere! Adam Hewison here, President of INO.com and co-creator of MarketClub, with your video update for Friday, the 7th of February.

After getting pummeled the past several weeks, the markets recovered some this week and appear as though the indices are going to close out either flat or with modest gains. Many popular stocks are showing gains on average of about 3%, not a bad move given how much they were pushed down.

Gold and crude oil also moved in the same direction, each gaining on average a little less than 1% for the week. The mighty Dollar on the other hand did not fare so well this past week, losing close to 1% in heavy interbank trading. Continue reading "Is This A Dead Cat Bounce?"

Twitter: Should You Buy It?

Some stocks just never allow you to gain an edge through fundamental research -- even by the most rigorous analytical minds.

These stocks become so popular that they become disconnected from any sort of fundamental valuation, and you can simply hold your nose and buy along with the crowd. Or you can be gutsy and look to sell shares short.

Score one for the fundamental analysts. Heading into quarterly results, Twitter (NYSE: TWTR) was a major focus for short sellers, as I noted three weeks ago. The short interest has risen further since that article was published, to 32.7 million shares by mid-January.

And these short sellers may be tempted to lock in gains after shares plunged more than 20% this week. But they shouldn't close out those short positions just yet -- Twitter has an additional 20% to 25% downside from here.

Twitter faces two challenges: It needs to sharply boost its audience, and it needs to figure out how to make much more money off of that audience. These are concerns I spelled out late last month on our sister site ProfitableTrading.com. Among the reasons why this stock may be headed to just $40 (or lower): Continue reading "Twitter: Should You Buy It?"