Stocks Peak One Year After Bonds (History Set to Repeat?)

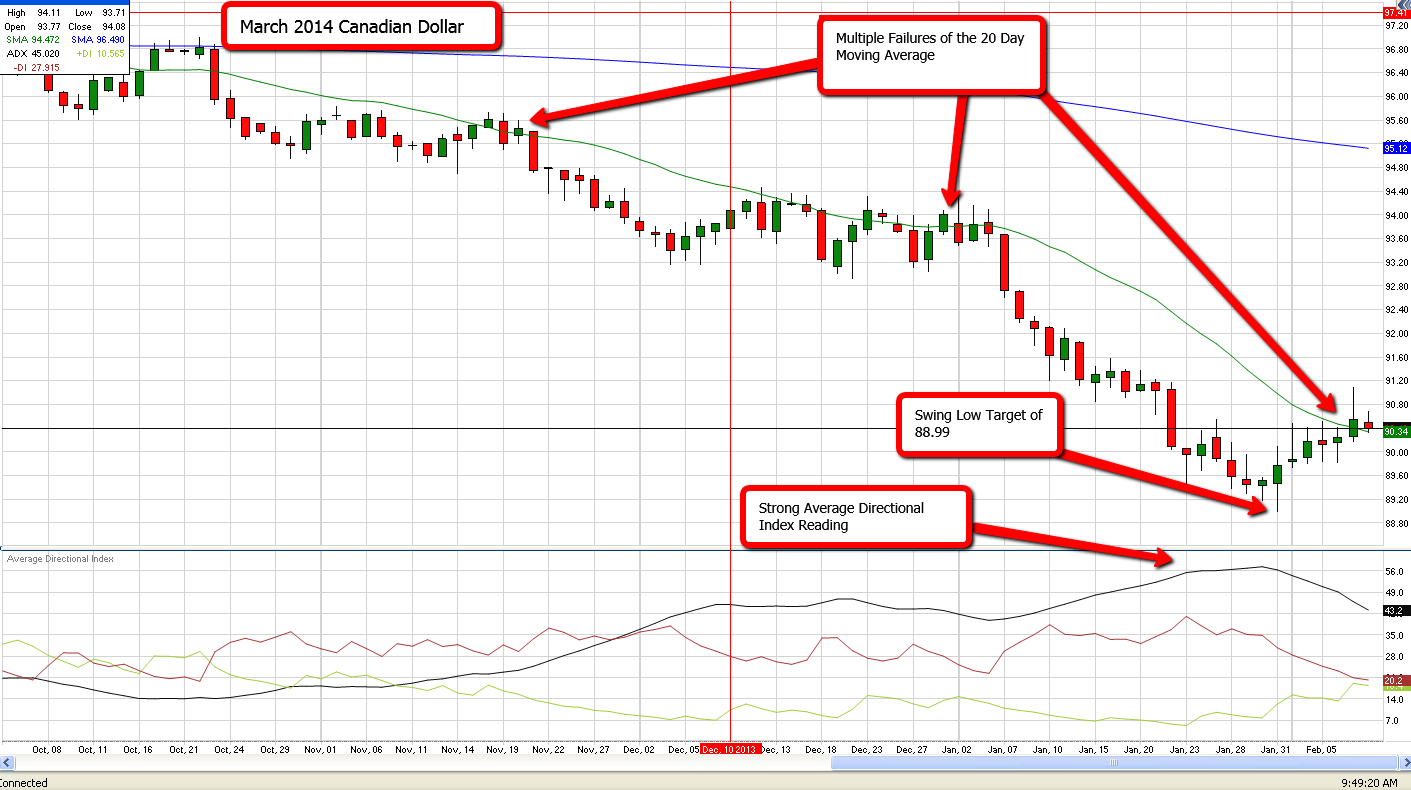
Financial parallels between the 1920s and today

By Elliott Wave International

When the financial media mentions the late 1920s, they usually mean the 1929 stock market top. But today's investors can also learn from what happened in 1928. That was the year that the bond market topped, while commodities peaked even sooner.

You can see this for yourself in a chart published in the September 2013 issue of Robert Prechter's Elliott Wave Theorist.

In the deflationary collapse of 1929-32, commodities fell
from lower peaks, not higher peaks; stocks fell
from all-time highs down to the bottom; and bond
prices fell from an all-time high a year earlier.

The Elliott Wave Theorist, July-August,
2013

These markets could see a similar outcome in the near future: Commodities peaked in 2008, while Treasury bonds topped in 2012. The high in the Dow Industrials remains December 31, 2013. Continue reading "Stocks Peak One Year After Bonds (History Set to Repeat?)"

Options Traders: Watch Out For This Little-Known Income Killer

Using a covered call strategy can be a great way to generate steady returns in your portfolio. As a general rule, I expect my covered call trades to increase my capital by about 25% to 35% per year, depending on the market environment.

(If you're new to the covered call strategy, click here for an introduction to how this strategy works.)

Whenever I set up a new covered call trade, there are a number of different dynamics to be aware of.

I always want to start with an underlying stock that has a high probability of increasing in price. I typically look for stocks with strong fundamental growth and a chart pattern that indicates investors are steadily buying the stock.

Next, I want to make sure that the option contract we use has plenty of premium built into it. Since we make our income by selling attractively priced call options, we need to make sure we're getting a good value for the contracts we sell. Continue reading "Options Traders: Watch Out For This Little-Known Income Killer"

These 4 Things Are Key To Trading In 2014

Hi Traders,

I've just completed a little report with an extended analysis of the S&P 500 that I'd like to share with you. It outlines 4 factors that are key to trading this year, as well as 9 critical technical signatures. By understanding what to look for, you can best protect the profits that you may have made in 2013's gangbuster and unprecedented year.

You'll receive instant access to this extended analysis on a private page. Be prepared and know exactly what to look for as 2014 trudges along. I hope you enjoy!

Access Analysis - These 4 Things Are Key To Trading In 2014

Best wishes as always,

Adam Hewison
President, INO.com
Co-Creator, MarketClub

It's Tricky Tuesday, So Be Careful

Hello traders everywhere! Adam Hewison here, President of INO.com and co-creator of MarketClub, with your video update for Tuesday, the 11th of February.

Tricky Tuesdays

What are they and why do they matter? Oftentimes bull and bear markets come to an end on a Tuesday, why is that? It all has to do with momentum. Typically a market builds up momentum over the weekend and that enthusiasm tends to carry over into Monday and early Tuesday trading. This is the same momentum rule I use for the "52-Week New Highs on a Friday" trading strategy.

Rule #1: On a new 52-week high when the market closes at or close to its high on a Friday, buy and go home long for the weekend. Continue reading "It's Tricky Tuesday, So Be Careful"

Chart of The Week - Canadian Dollar

Each Week Longleaftrading.com will be providing us a chart of the week as analyzed by a member of their team. We hope that you enjoy and learn from this new feature.

This week’s focus turns to the March Canadian Dollar futures, where recent down-trend market structure has given way to a possible continuation of the sell-off in coming days.  After posting a recent swing low of 88.99 on January 31st, the market has since experienced short covering off of the recent sell off.  Last week, we saw consolidation off of the recent short covering.  In weeks past, we have seen multiple tests, and failures, of the 20 day moving average, making this indicator a key resistance point.

As we open this week, if we see yet another failure of the 20 day moving average, traders will likely expect a sell off if the market breaches Friday’s low of 90.17.  Along with a strong average directional index reading, the March Canadian Dollar could have strong downside momentum in the near term.  If this scenario takes place, the likely target would be the March Canadian Dollar’s swing low of 88.99.  Continue reading "Chart of The Week - Canadian Dollar"