Is Platinum A Runaway Train?

It looks like my post titled "Platinum Could Rocket To $1912" published in November 2019 could turn prophetic as the price of platinum price is moving quickly in the direction of the called target. The majority of readers supported this idea at that time, although with a small margin.

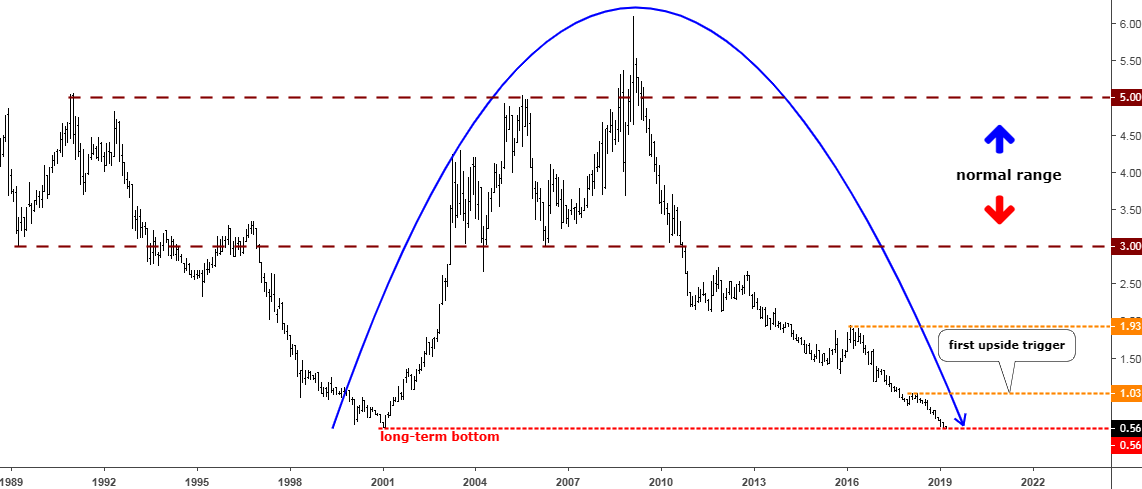
Below is that very chart where I shared the global structure for the large complex correction in the platinum market.

Platinum
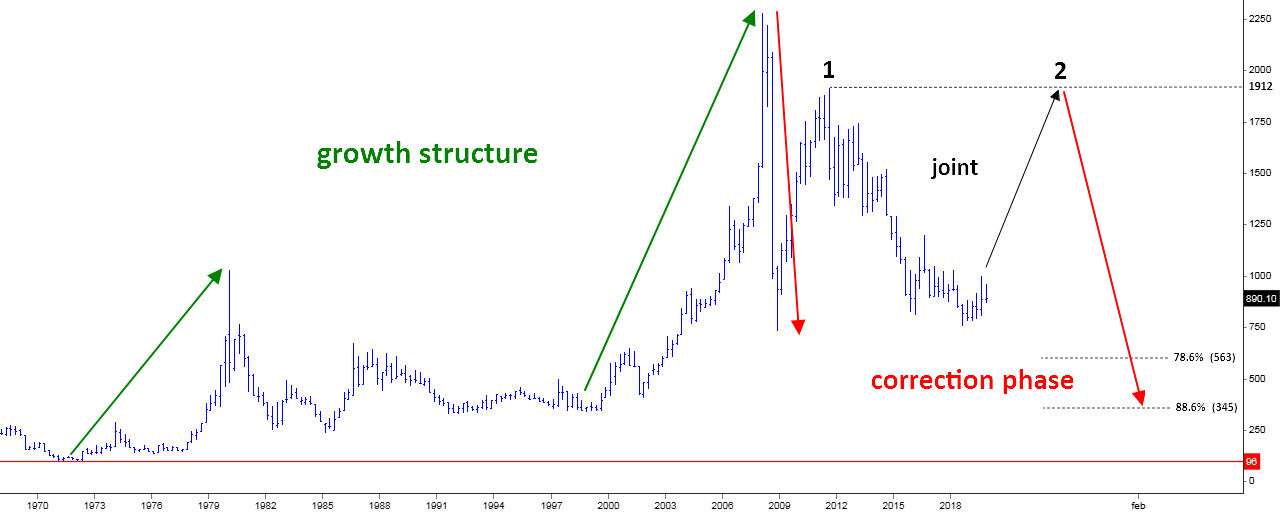
Chart courtesy of stooq.com

To remind you, the idea was that leg 2 to the upside (black up arrow) should complete the "joint" between large red legs to the downside. It was thought to retest the top of leg 1 above $1900. The price was at $890 then. Continue reading "Is Platinum A Runaway Train?"

Platinum Could Rocket To $1912

Last time I updated the platinum chart in March was when "Palladium Pushed Platinum To A Record Low" within the ratio mostly due to the strength of palladium. Platinum has hovered around $900 for three years now as it was lost and forgotten after the “execration” of diesel engines. This "fallen angel" had been shaping a sideways consolidation this past spring, and I had thought it could repeat 2018’s drop following the same structure. The targets were set at the $640 and $401 on the downside, and the invalidation point was assigned to $1034.

Let's see below how you voted for the future of platinum.

Platinum

Most of you picked the $1034 option, which implied the breakout of the consolidation in the upside direction towards the invalidation area. This was the closest call as the majority voted for a bullish move, which, indeed, had happened as platinum couldn't break below the consolidation valley of $788 and bounced up to reach the $1000 level this past September. That price hasn't been seen since February 2018. Again, this was your amazingly accurate prediction, not only for that period but also for a longer-term outlook as I spotted it in the big chart below. Continue reading "Platinum Could Rocket To $1912"

Palladium Reached Double Resistance

Back in March, I shared with you an updated chart for palladium. It hit the record high of $1553 by that time to become the most precious metal, and it still is.

Every time the price makes a record high, there is a chance for a reversal. In that post, I measured the AB/CD segments of the upside moves on the chart and both short term and long term measurements showed the equality, which meant the possible exhaustion of a Bull Run. I didn't try to guess the top that time and asked your opinion. Below is the distribution of your votes.

Palladium

Most voters chose the $1600-2000 range for the top of the palladium price, which meant that the established new record should be updated to the upside. Your prediction amazingly came true, but this bet wasn't that obvious as it played out only five months later, when the metal refreshed the all-time high at $1601 in July as only then the price entered the forecasted range. Last week the price did it once again to hit a new record high of $1750, confirming your accurate prophecy. Congratulations!

Let's see what happens with the palladium futures these days in the weekly chart below. Continue reading "Palladium Reached Double Resistance"

Palladium Pushed Platinum To Record Low

A year ago I wrote about the platinum/palladium ratio as it was on the edge, and there were two possible options, to restore the historically normal supremacy of platinum (target 1.93 oz) or to prolong the triumph of palladium (target 0.56 oz.).

This month the Platinum/Palladium ratio hit a new record low of 0.55 oz. amid the rocket move to the upside in the palladium market; the latter became the most precious metal beating gold. Let’s take a look at the big picture below.

Chart 1. Platinum/Palladium Ratio Monthly: New Record Low

platinum/palladium ratio
Chart courtesy of tradingview.com

The chart above starts with a robust growth to the upside from 3 to 5 oz. and this move had set the “normal” range for the fluctuations of the ratio within the next two decades. It was interrupted only once in 1997 when the ratio fell out of the range and quickly dropped to establish a previous record low of 0.56 oz. in 2001 amid rumors that Russia would ban palladium export. It was a textbook example of a “sell rumors - buy facts” market behavior, the ratio was down on rumors and then when the reality didn’t confirm it the ratio quickly returned to the normal range making a beautiful V-shape pattern. Then the ratio had spent another decade in that range. Continue reading "Palladium Pushed Platinum To Record Low"

Platinum Could Restore Its Supremacy Soon

Aibek Burabayev - INO.com Contributor - Metals - Platinum


Last October I focused on the rare case when the price of palladium, for the first time in many years, could surpass the usually dominant platinum price. Both, common sense and chart analysis of the palladium price suggested that the triumph of this metal could be temporary. In the charts below, we can see if this conclusion turned out to be right.

Chart 1. Platinum/Palladium Ratio Monthly: Half-Half

Platinum
Chart courtesy of tradingview.com

This time I would like to start with the chart of the relative strength of the two metals which is clearly traceable through the platinum/palladium ratio. This ratio is falling sharply from the 2009 high at the 6.09 oz showing the dramatic weakness of platinum compared to palladium. In the chart above, I only show you the period when the drop started to decelerate, and the trend turned flat. Continue reading "Platinum Could Restore Its Supremacy Soon"