Platinum And Palladium Update

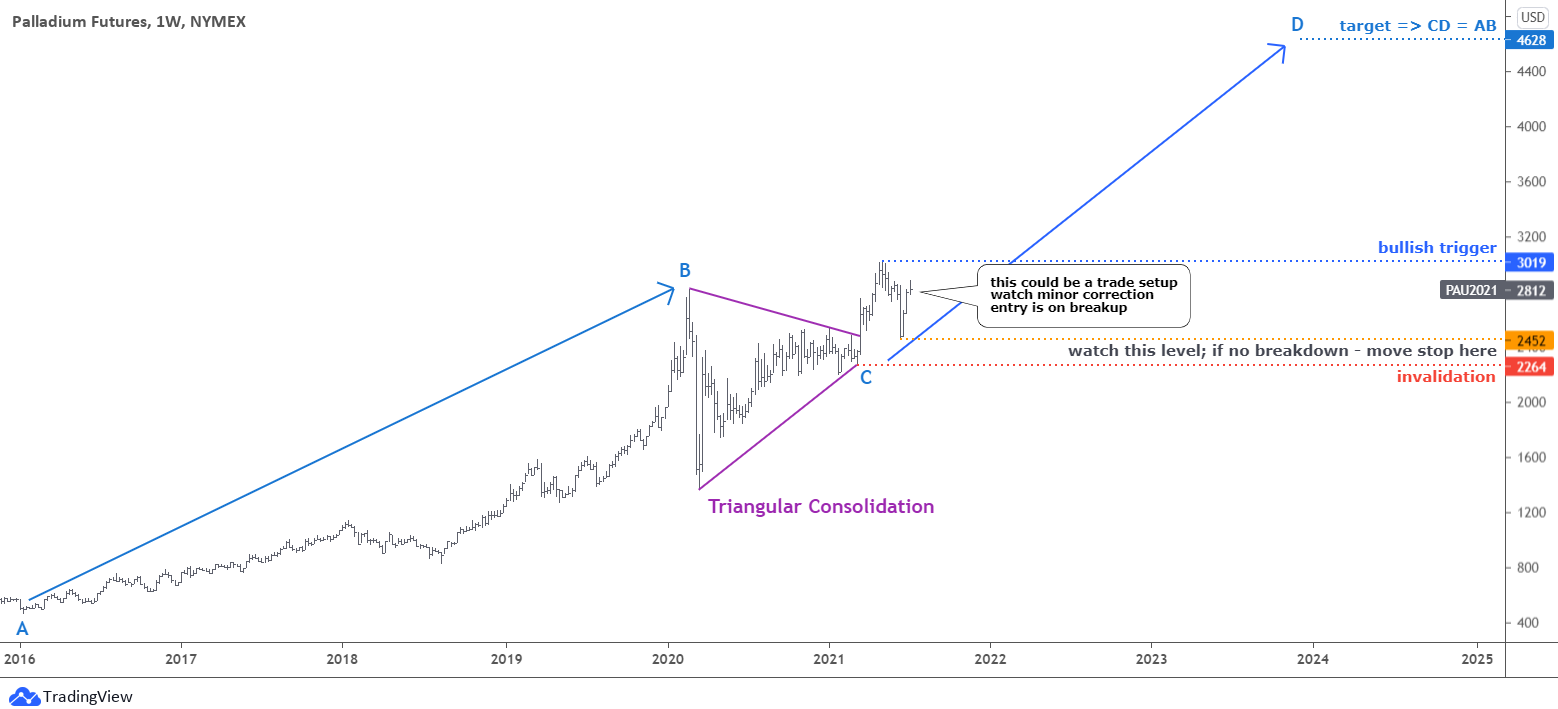
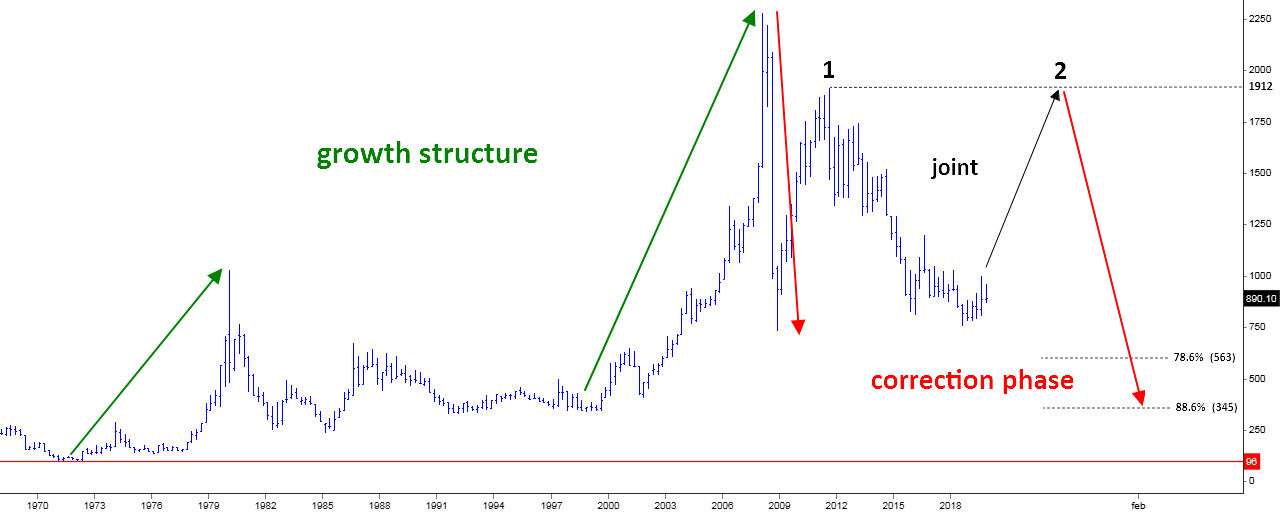
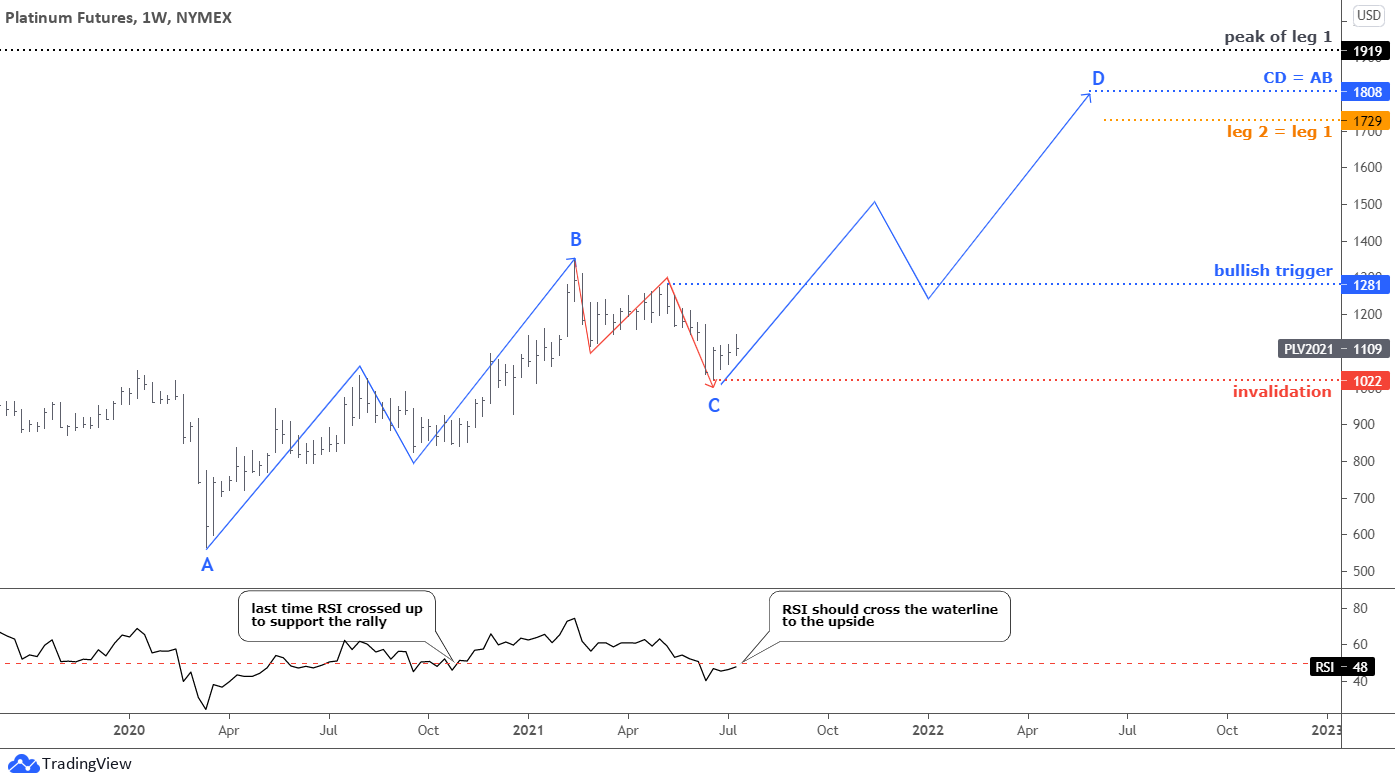
I put the platinum first as it has a clearer structure. The big map has remained unchanged since 2019; I put it down below to brush up.

Platinum

We are in leg 2 (black) with a completed AB part (next chart). I expected the CD part to start earlier. However, the bullish trigger was left untouched and the market collapsed further down.

Platinum

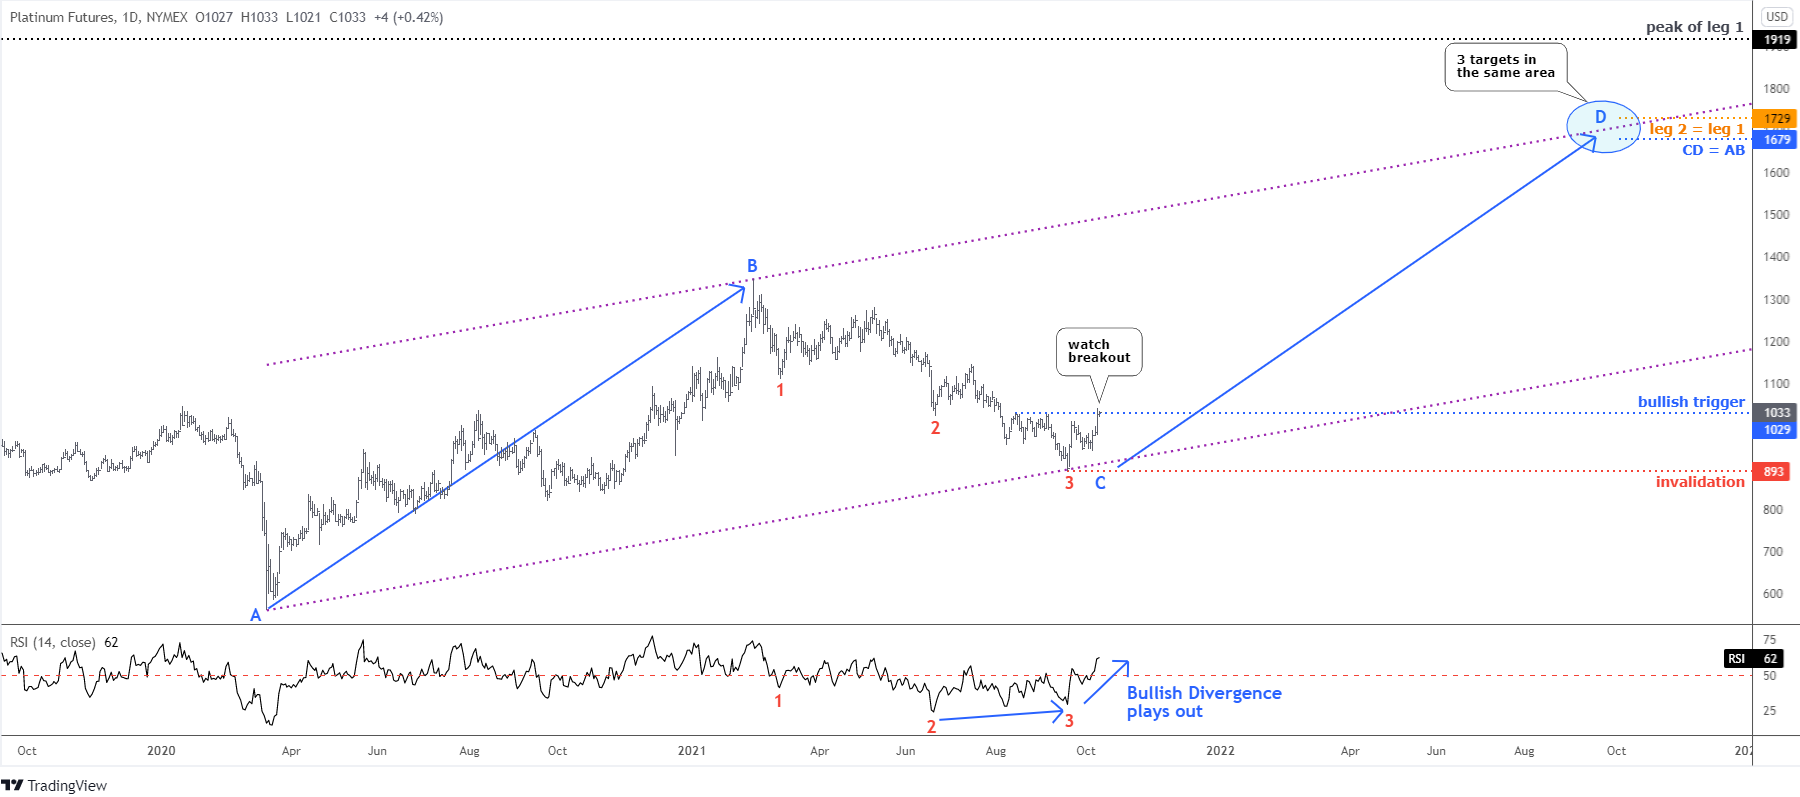
The third red leg down has hammered the platinum futures price below $1,000 handle to hit the valley in $893. It is amazing how symmetry works here, as all three legs are almost equal to each other. It is a good sign for the platinum as it suffered a lot. Continue reading "Platinum And Palladium Update"

Palladium Futures To $4,628?

Last summer I spotted a hot trading opportunity for you with 45% potential gain as Palladium futures were set to retest the all-time high. The progress was not as nimble as I thought; however, the target was reached this April as the price even overlapped it. Most of you supported that option, and I hope you enjoyed that gain.

Weekly palladium Chart

It looks like this champion metal offers another stunning opportunity for traders.

The crawling move to the upside since 2016 with a rocket style ending in 2019-2020 was marked as AB part. Continue reading "Palladium Futures To $4,628?"

Is Platinum A Runaway Train?

It looks like my post titled "Platinum Could Rocket To $1912" published in November 2019 could turn prophetic as the price of platinum price is moving quickly in the direction of the called target. The majority of readers supported this idea at that time, although with a small margin.

Below is that very chart where I shared the global structure for the large complex correction in the platinum market.

Platinum
Chart courtesy of stooq.com

To remind you, the idea was that leg 2 to the upside (black up arrow) should complete the "joint" between large red legs to the downside. It was thought to retest the top of leg 1 above $1900. The price was at $890 then. Continue reading "Is Platinum A Runaway Train?"

Gold Falls As Silver Misses Target

Both top metals couldn’t sustain the growth, although silver was more convincing than gold this time again.

Let’s start with the updated gold chart below.

gold
Chart courtesy of tradingview.com

Gold is still consolidating as it couldn’t overcome not only the nearest peak of $1766 but it also failed right at the top of the AB segment of $1748. The RSI dipped into the bearish zone below the crucial 50 level. So, it’s the right time to put our classic instrument called Fibonacci retracement level as gold watches ground while both feet are in the air. The first important 38.2% Fibonacci retracement level could offer support at $1636. Continue reading "Gold Falls As Silver Misses Target"

Are Palladium, Gold And Silver Set To Takeoff?

In this post, I'll go over the charts for palladium, gold and silver, but first I would like to start with palladium futures as it has the most potential gain to reach this round. At the start of May, I shared with you the map with equal opportunities for this champion metal to either break up or down. Here is how you saw the future for palladium in the graph below.

Palladium Poll

The majority chose the “break down” option, although with a minor advantage, but this bet played out as the metal’s price dipped one more time in the third leg down of a large correction. You were right again!

Now, let’s get down to the hot opportunity that I spotted for you on the palladium futures daily chart as it’s worth watching on the Gold & Silver Primetime.

Palladium Gold Silver
Chart courtesy of tradingview.com

The chart structure of palladium futures on the daily time frame could indeed be posted in the trading textbook as it is neat and smooth. I put detailed explanations here and on the chart as this metal gives such an excellent opportunity for education. Continue reading "Are Palladium, Gold And Silver Set To Takeoff?"