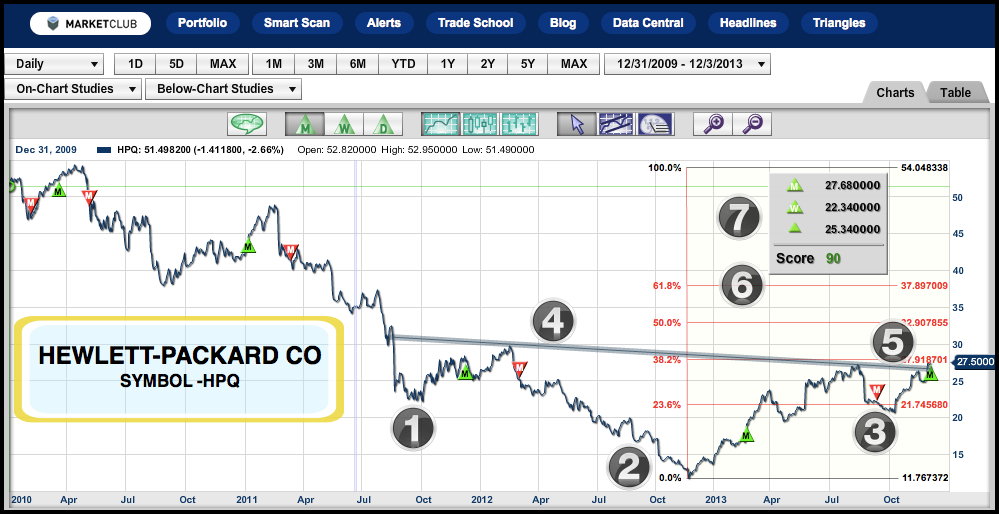
Remember Hewlett-Packard (NYSE:HPQ)?

Once the Apple of its day, Hewlett-Packard (NYSE:HPQ) made some unfortunate decisions that then tanked the stock. After reaching a high of $54.75 on April 16, 2010, the stock of Hewlett-Packard hit a low of $11.35 some 32 months later.

Since that time, the stock has made a recovery into the mid to high 20s, but still has further to go on the upside based on pure technical analysis. Continue reading "Remember Hewlett-Packard (NYSE:HPQ)?"

This Pioneering Chart Pattern Is Still One Of The Best

By: Amber Hestla, Michael J. Carr

The head-and-shoulders (HS) top is one of the best-known patterns in technical analysis. This pattern was first written about in 1930 by a financial editor at Forbes magazine who described how the HS forms and how it can be traded.

Many readers are familiar with the HS pattern. On a price chart, there will be three peaks in price at the end of the uptrend, with the center peak (the head) being higher than the other two. The peaks on the sides (the shoulders) should be about equal in height. Continue reading "This Pioneering Chart Pattern Is Still One Of The Best"

Revisiting the Dow Jones Industrial index (new video)

In today's short video I am going to be revisiting the Dow Jones Industrial index (DJI).

I think it's very interesting to see what our "Trade Triangles" are doing as well as what our Talking Charts are saying about this market.

I'll also be using MarketClub's Fibonacci tool. If you have not seen this tool in action, I strongly recommend that you watch today's video.

You can watch this video with my compliments and there is no registration requirements. I would love to get your feedback about this video on our blog.

All the best,

Adam Hewison
President, INO.com
Co-creator, MarketClub

Perception indicates that the bear is back (New DOW video)

Adam Hewison here and I've just finished a new video on the Dow Jones Industrial Index (DOW) that I'd like to share with you.

This may be a short video, but I think you'll get a lot out it. I'll analyze what's going on right now in the DOW, how it has developed over the last six months, and where I expect the DOW to go in the next six months.

As I've discussed before, perception is everything in the marketplace. I believe that perception is beginning to change in this market and the bears are back.

You can watch this video with my compliments and there is no registration requirements. I would love to get your feedback about this video on our blog, so comment away!

All the best,

Adam Hewison
President, INO.com
Co-creator, MarketClub

Here's One Chart Formation You Can Rely On

Head and Shoulders Formations ... it's not a shampoo

One of the oldest and most reliable of all chart formations is the Head and Shoulders Formation. This formation takes place usually after a trend has been established and in place for some time. It can in rarer instances take place in a continuation pattern and still be effective. The two formations we are going to look at today are a Head and Shoulders Top (HAST) and a Head and Shoulders Base (HASB). Both of these formations have a high degree of accuracy and usually portend a major change in direction for a market.

A normal Head and Shoulders Top (HAST) or Head and Shoulders Base (HASB) has a right shoulder, a head, a left shoulder, and a neckline. More complicated formations have double heads or double shoulders and, in some rare instances, triple shoulders. Both a Head and Shoulders Top (HAST) and a Head and Shoulders Base (HASB) have a neckline, and a Head and Shoulders formation should only be considered completed when the neckline is broken.

Once the neckline is broken, it is possible that prices can set back and retest the neckline. It is perfectly normal and healthy for a market to do this. Care must be taken that the retest of the neckline does not exceed by too much the original neckline and thereby abort the formation.

As a general rule, if the market sets back through its neckline and violates the left shoulder formation, it should be viewed as invalidating the original buy or sell signal. In order to predict the extent of a move a measurement is taken from the top part of the head to the neckline. The Head and Shoulders Target Zone (HATSZ) is created when you add or subtract this distance from the neckline, depending on whether it’s a Head and Shoulders Top (HAST) or a Head and Shoulders Base (HASB).

See how many chart formations show up in MarketClub. This type of formation occurs in stocks, futures, forex, metals and mutual fund markets.

Every Success,

Adam Hewison

President, INO.com
Co-creator, MarketClub