In this post, I would like to share with you the comparative dynamics of gold and top gold stocks starting from the date when the recent local bottom of gold was set at $1241 on the 7th of October, 2016 to see how top gold stocks reacted to the recent gold reversal.
Chart 1. Gold And Top Gold Stocks: Not All “Birds” Flew To The North
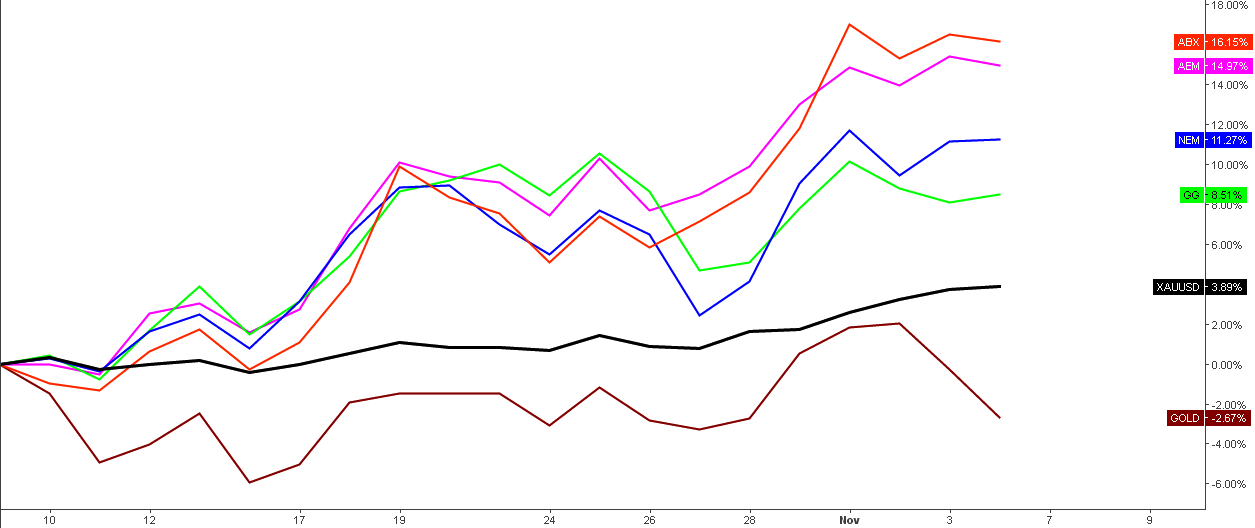
Chart courtesy of tradingview.com
I put the chart the gold together with the 5 top gold mining stocks by market cap, which I started to cover this August. These are (ranked by market cap): Continue reading "Gold And Top Gold Stocks: Not All "Birds" Flew To The North"