A month ago I got the short entry trigger in the copper futures. The idea started to emerge this February, and I was watching copper closely from that time and posted updates for you. And you witnessed how I moved entry triggers higher and higher until the price has finally pushed below the last one. And this was the true benefit of avoiding simple guessing to wait for the signal.
In the chart below I would like to show you how that trade was managed and what the outcome was.
Copper Futures Daily Chart: Walked Away Without A Scratch
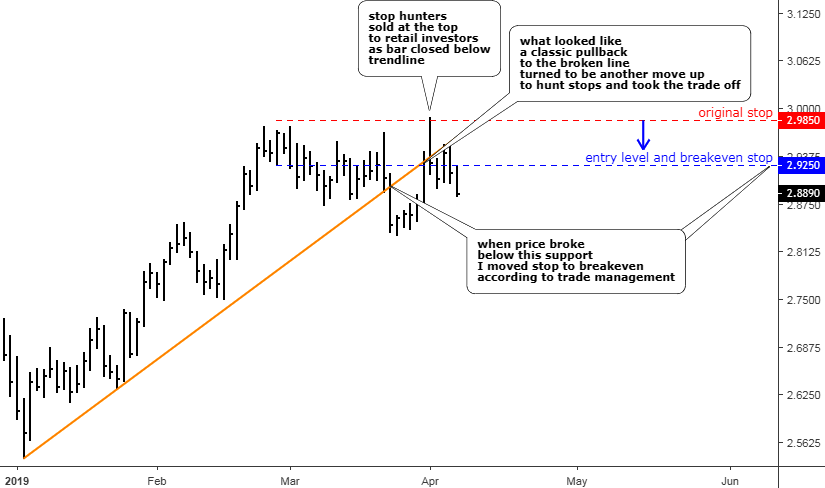
Chart courtesy of tradingview.com
The price of copper showed great volatility around the entry level (blue line) moving within a 10 cent range between $2.87 and $2.97. This happens due to a clash of opposite market forces at the extreme levels. Finally, the bears took the ball and pushed the price not only below the range but also below the crucial orange trendline support. Copper has hit the one month low at the $2.8345 on the 25th of March. At that stage, the short position had a profit of 3%, and I moved the stop to breakeven to enjoy the safe ride. This is a part of trade management as we should try to avoid risks as much as we can because we cannot control the market; we can only control ourselves and manage our risk. Continue reading "Copper Trade: Stopped Out"