

I started to cover European gold at the beginning of this year when it was at the 1000 EUR level. In spring I added silver to the pack as it had an interesting setup on the chart. Today I would like to share with you an update of the charts and to show you the outcomes.
Let us start with a single currency chart and see if we can find some clues which could help us with the metal crosses charts.
Chart 1. EURUSD Monthly: RSI Calls For Higher High

Chart courtesy of tradingview.com
Now, after almost two months, the dust of BREXIT hysteria has settled. The euro has managed not just to survive, but to score more than 2 cents after it touched the $1.09 mark on the referendum selloff in June. Friedrich Nietzsche once said - "That which does not kill us makes us stronger." The light version of the chart above had been shown to you in May.
The euro is still sitting on the very important trendline (dark gray) and the similar price action was earlier when the price approached this trendline. I mean the same combination of lower highs amid higher lows. The RSI has the same divergence as in 2001. This time, we have a flatter downtrend (orange) and the RSI is still below its trendline unlike in the previous case.
There are three triggers which could help the euro to have a big against US dollar once they are broken:
1. Midline of the downtrend (orange) at $1.14 mark
2. Falling trendline (orange) on the RSI sub chart
3. 50 level on RSI sub chart
Despite that the RSI is rising and the price is squeezed between the midline and the multi-decade support like 15 years ago, we should be ready to face the opposite outcome – the break below the support and heavy drop of the euro. And I will tell you that the majority of the trading community anticipates the latter variant, while I am focused on the first bullish scenario. Let us wait and see!
Chart 2. Gold Vs. Euro Monthly: 760 EUR For Ounce?
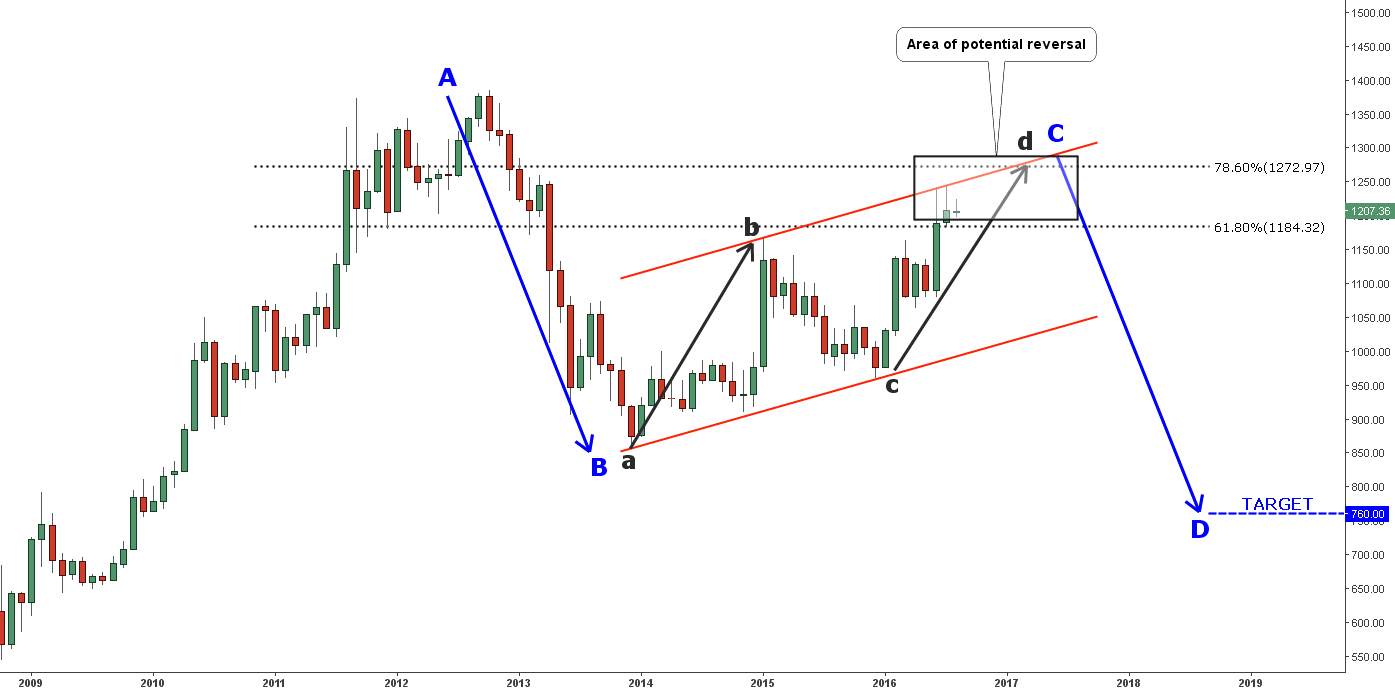
Chart courtesy of tradingview.com
Many times we have witnessed the magical power of math ratios on the charts. In my first post in January this year I shared with you the alternative scenario of a complex correction with the target of the gray AB/CD concept at the 1272 EUR mark (repeated here in gray arrows and small letters). In my next post in April the target located at the top of the trend was in the same area at the 1271 EUR level. And today I added the 78.6% Fibonacci level, which points at the 1273 EUR. It’s triple coincidence!
From a technical point of view the target set in April was hit as I underestimated the sharp angle of the bullish attack and the top of the trend was reached, but earlier and at a lower level (1244 EUR). In my gold/$ update last week we saw that gold couldn’t even reach the minimum Fibonacci retracement level at 38.2%. The European gold has another story – it could break almost all of the retracement zones except the last one at 78.6%. It’s really a deep pullback in gold against the euro.
If we assume that the bullish scenario in the EURUSD (chart 1) is in place and the bearish gold/$ scenario from my earlier post is valid, then we should be ready for the drop of gold against the euro. I highlighted the area of the potential reversal in the black rectangle on the chart. The price can make another swing upside to the 78.6 Fibonacci level before a total reversal. According to the AB/CD concept (highlighted in blue) the target for another drop is set at the 760 EUR level where the CD segment is equal to the AB segment by length. It’s quite an ambitious goal and it could be reached only with a very strong euro and weak gold.
Chart 3. Silver Vs. Euro Monthly: It Can Surprise Us!
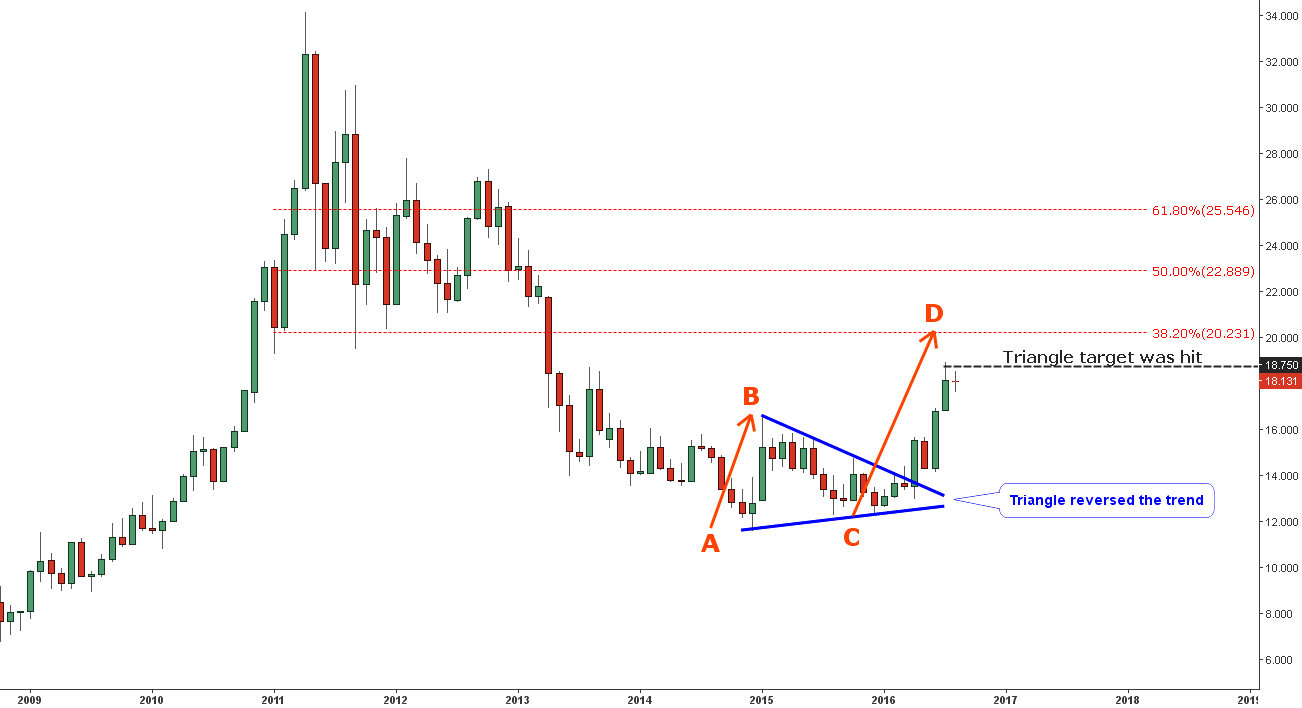
Chart courtesy of tradingview.com
European silver is a newbie in our blog. Nevertheless, it could win a flawless victory, hitting the triangle’s target set in my April post at the 18.75 EUR mark.
It looks like silver still has the energy to climb further to the upside against the euro. I put the Fibonacci retracement on the chart to check our position. If you visually compare chart 2 and chart 3, you would observe that silver fell deeper than gold and that is why despite the strong advance recently it is still below even the lowest Fibonacci retracement level at 38.2% (20.23 EUR).
If we apply the AB/CD concept where the CD segment is 1.618 times longer the AB segment (AB=CD already hit, so we should use next common multiplier) the target is set at the same 38.2% Fibonacci at 20.23 EUR mark.
It’s interesting that we have different outcomes from similar metals; we can justify it only by the different depth of price action when they were falling. Now silver can try to struggle as gold would choose to capitulate.
Intelligent trades!
Aibek Burabayev
INO.com Contributor, Metals
Disclosure: This contributor has no positions in any stocks mentioned in this article. This article is the opinion of the contributor themselves. The above is a matter of opinion provided for general information purposes only and is not intended as investment advice. This contributor is not receiving compensation (other than from INO.com) for their opinion.
The Euro has ended. The future problems, demography, economics are not as attractive as it was even 5 years later.
Beside France and Germany the other countries will be in trouble because of debt deficit and GDP.
Right now dollar is much more better perspective.
I'am not sure about the gold. In past it was percieved as a stable commodity but last 4 years showed that
volatility on that commodity is very high.
Gold and silver normally move together, you are suggesting that this will not continue? That would be highly unusual.
does ino trade triangles take into account the cot?. looking at the cot it looks extremely bearish for gold and silver---- very much deflationary
you got that right bill those charts are very vague and who cares about the euro gold and silver have broken correlation with currencies months ago and your right the cot contracts are extremely bearish