
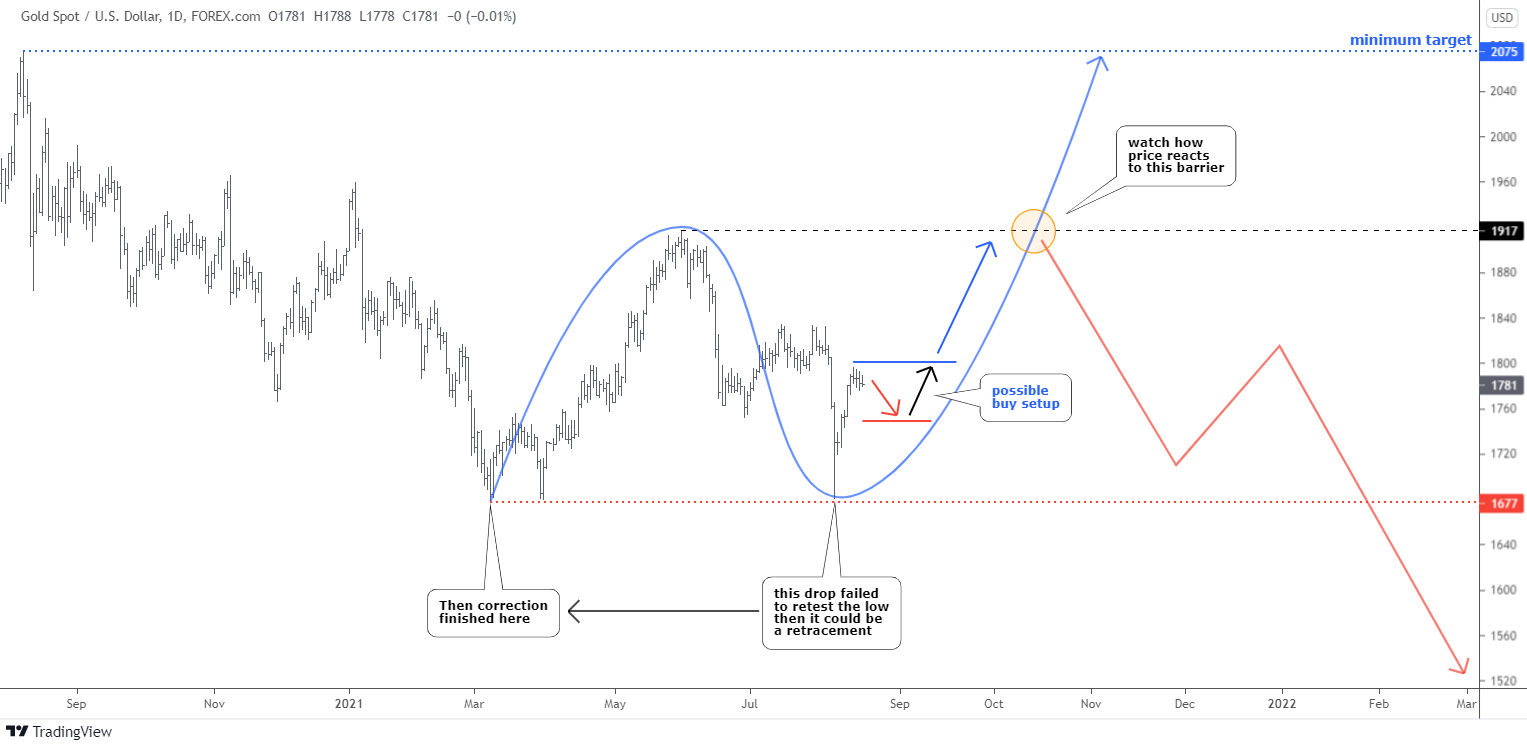
Gold follows the map posted in an earlier update.
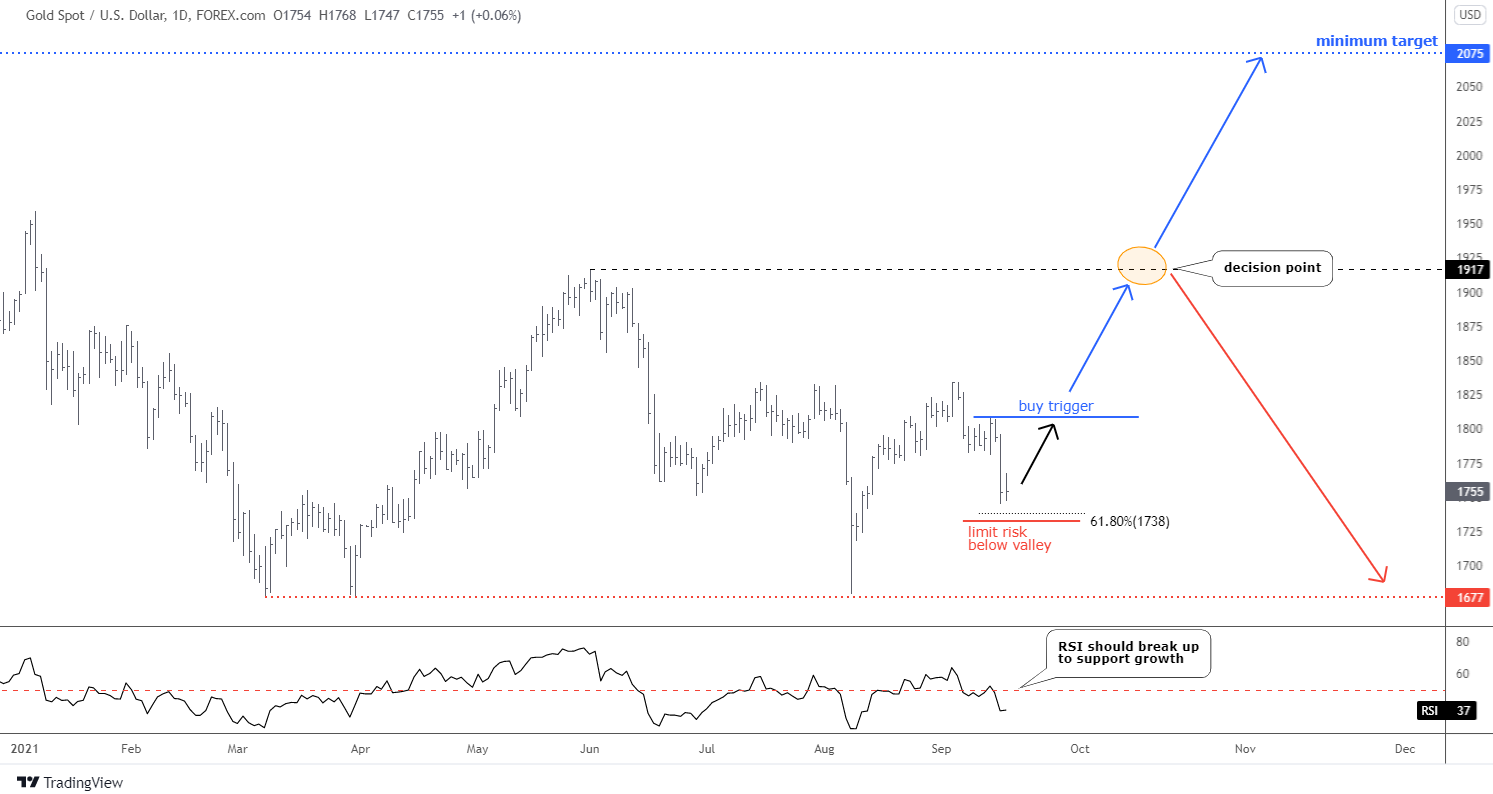
Gold dropped within two visible legs close to the area of 61.8% Fibonacci retracement level located at $1,738. The second leg down has overshot the size of the first leg reaching almost 1.272 of its distance. The RSI has shown two legs down either. Initially, the 50 level in the indicator’s sub-chart acted as a support, and then it turned resistance for the joint between two legs.
Last Friday’s bar could be a turning point as no fresh low has been established on that day. The buy trigger is located at the top of the joint between two legs down at $1,809. When the trigger is activated, consider limiting the risk below the valley of the current correction.
The firm barrier of the former top at $1,917 is a decision point. One should consider two options: either book the profit and wait for further clues or watch how the price reacts to that barrier and then make a final decision. Anyway, at that point, it would be better to move the stop loss at least to a break-even. Then you would enjoy the safe journey.
If you choose to take profit around $1,917, then the Risk/Reward ratio would stand at 1:1.7, with the risk limit below the most recent low of $1,745. The ultimate target of $2,075 raises the proportion to a stunning 1:4. But, of course, if the market drops lower, then the ratios would fall accordingly.
Last week the Bloomberg posted an interview with the BlackRock Inc. fund manager Russ Koesterich. He said that the fund has sold almost all of his gold holdings on expectations that rates will normalize as the global economy rebounds.
“Rather than own an asset that doesn’t produce any cash flow, we’d rather hedge some of the near-term upside in inflation with stocks that have pricing power,” Koesterich said, citing industrials, materials, and consumer sectors as examples.
This outlook of the world's largest asset manager could mean the failure of gold to overcome the $1,917. Of course, nobody knows the future; let us wait and see.
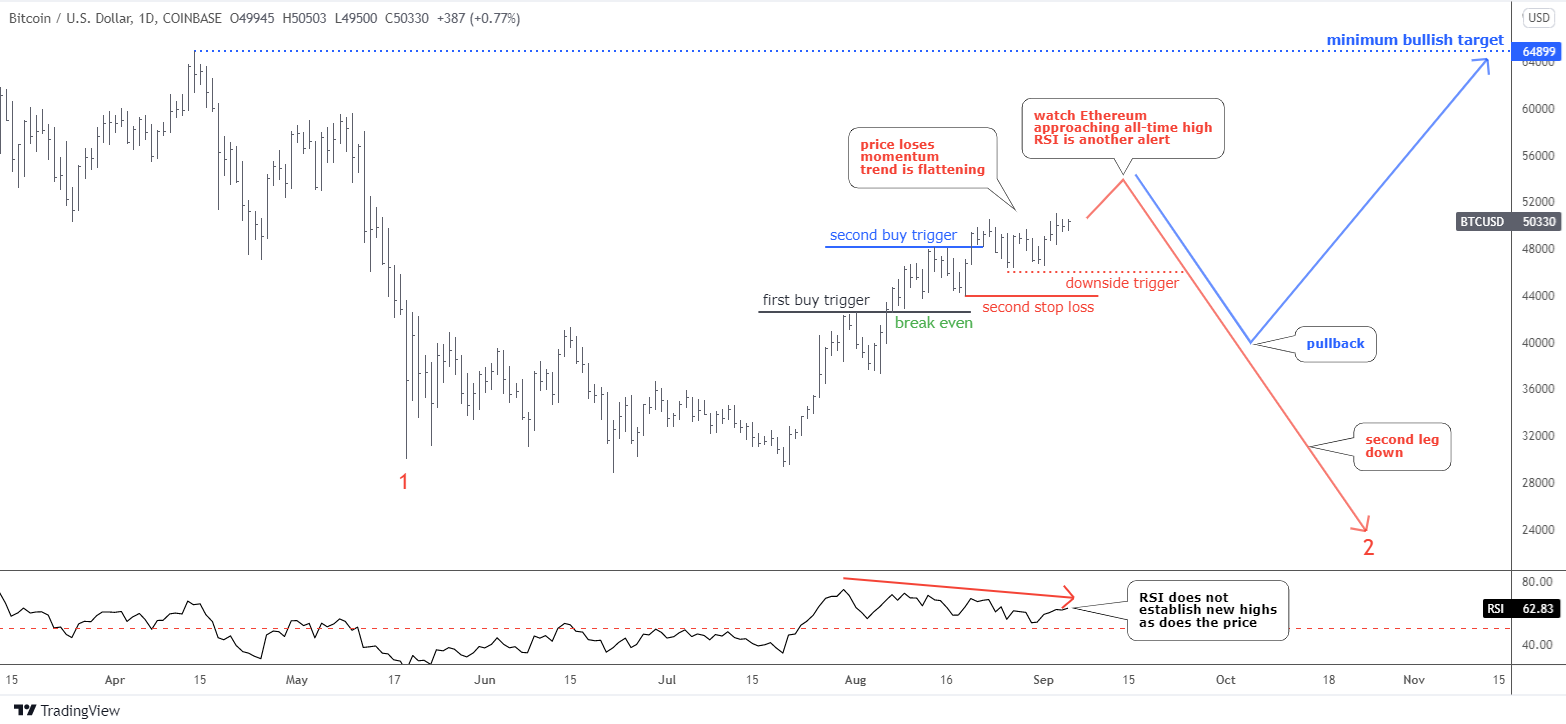
Luckily, the warning call for Bitcoin was posted just ahead of the drop, so you could have time to consider taking the profit or adjusting the risk.
Most of you chose the “HODL” option; the “book profit” was the second popular vote.
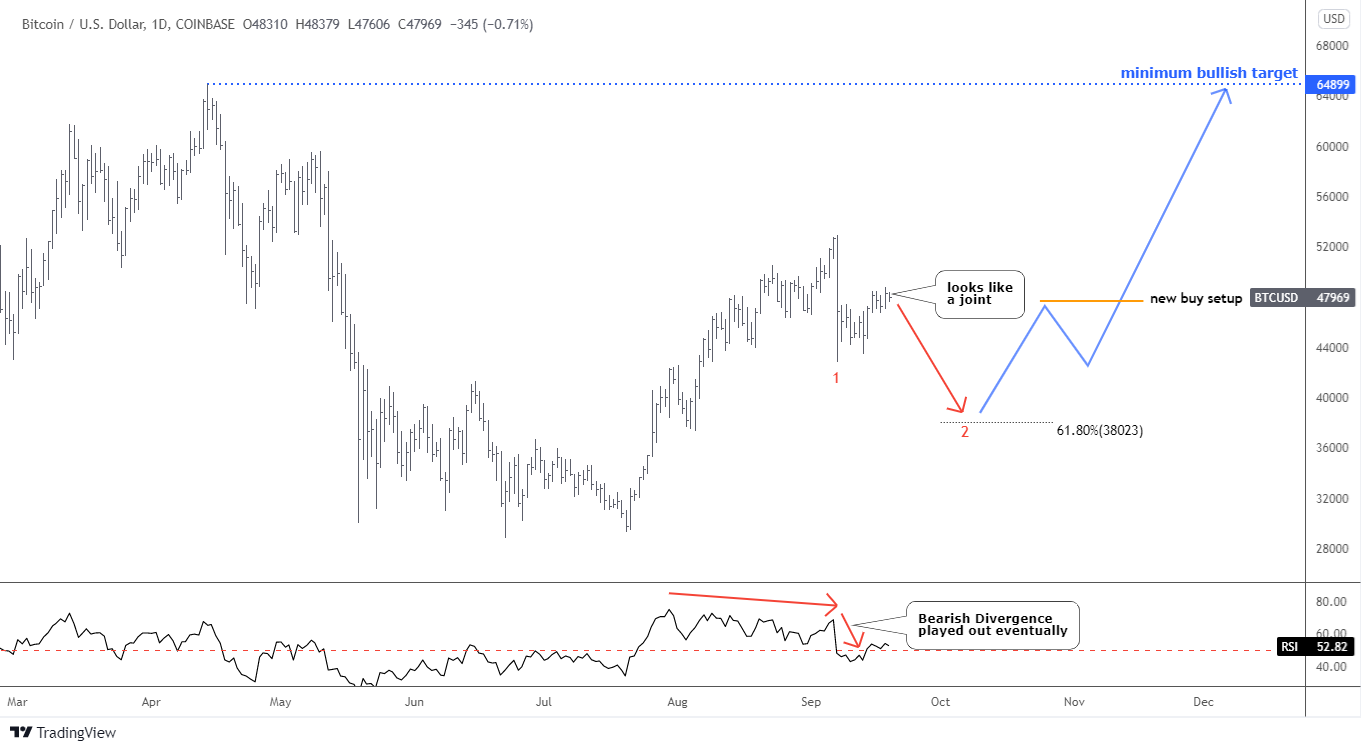
All bearish technical alerts played out eventually, including Bearish Divergence on RSI and a weakening trend. The price reached the area of $52-55k, where I thought it to reverse. Bitcoin has almost hit the $53k at the recent top and then dropped like a rock.
I consider the initial sharp move down as the first leg (red 1) within a larger corrective model. The structure is similar to what we witnessed in the gold chart above. Current sideways consolidation could be a joint between two legs down.
The next leg down could hit the 61.8% Fibonacci retracement level around $38k. This level coincides with the area where red leg 2 would travel an equal distance with red leg 1. Earlier, the main coin retraced 61.8% several times on its way to $53k.
In an earlier update, I showed you the map with two paths. I skipped the large leg 2 down option this time, as it will be validated only on a touch of the most recent bottom.
Aibek Burabayev
INO.com Contributor, Metals
Disclosure: This contributor has no positions in any stocks mentioned in this article. This article is the opinion of the contributor themselves. The above is a matter of opinion provided for general information purposes only and is not intended as investment advice. This contributor is not receiving compensation (other than from INO.com) for their opinion.