
The king currency has finally hit the first long-term target of $114 that was set in the summer of a distant 2019 when it traded around $96.
That aim wasn’t clear then as the dollar index (DX) looked weak in the chart. The short-term structure was similar to a pullback after a heavy drop.
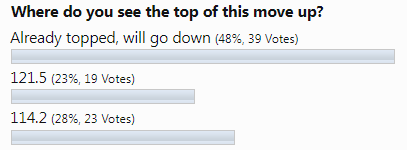
The majority of readers did not believe the DX would ever raise its head as you can see in the 2019 ballot results below.
However, I had found a bullish hint in a very big map, and I warned you “Don't Get Trapped By Recent Dollar Weakness”.
Back in August, you had already been more bullish on the dollar as you voted the most for the target of $121.3 in the earlier post. This confidence is due to the certain position of the Fed, which resolutely fights the inflation, lifting the rate aggressively round by round.
Let me update the visualization of the real interest rate comparison below to see if the dollar still has fuel to keep unstoppable.
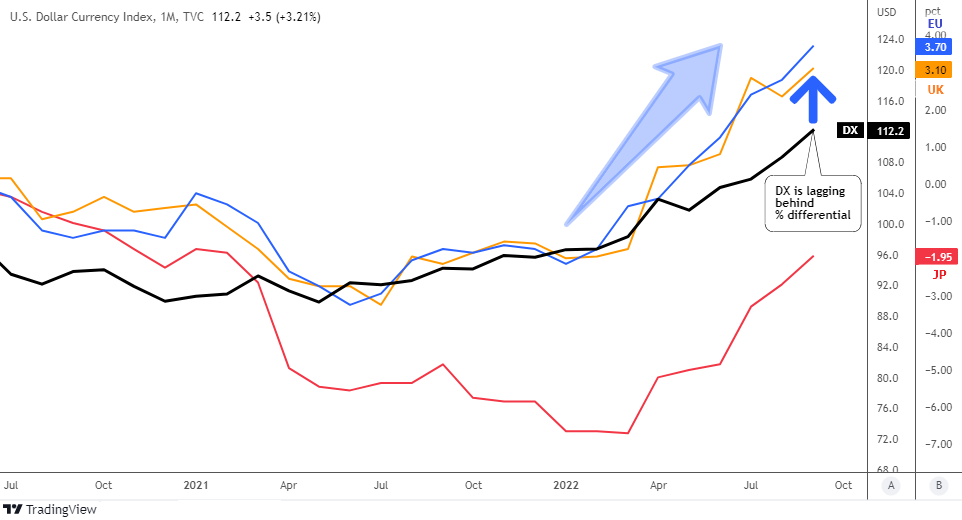
The real interest rate differentials are shown on the scale B: blue line for U.S. - Eurozone, orange line for U.S. – U.K. and the red line for U.S. – Japan.
As you can see in the chart above the dollar’s buffer only grows over time as the trend gets even sharper. In August, the blue line was at +2.4%, the orange line was at +2.35% and the red line was at -3.3%. The change is huge in favor of the U.S. compared to its rivals.
Currently, the DX is lagging behind two differentials: U.S. – Eurozone (the largest component of the DX) and U.S. – U.K. (3rd largest component of DX). We can clearly observe the potential of the dollar to close that gap, rallying at least in the area of $120-$123, where the next target of the distant 2001-year top is located.
Let me refresh the technical chart below for more details.
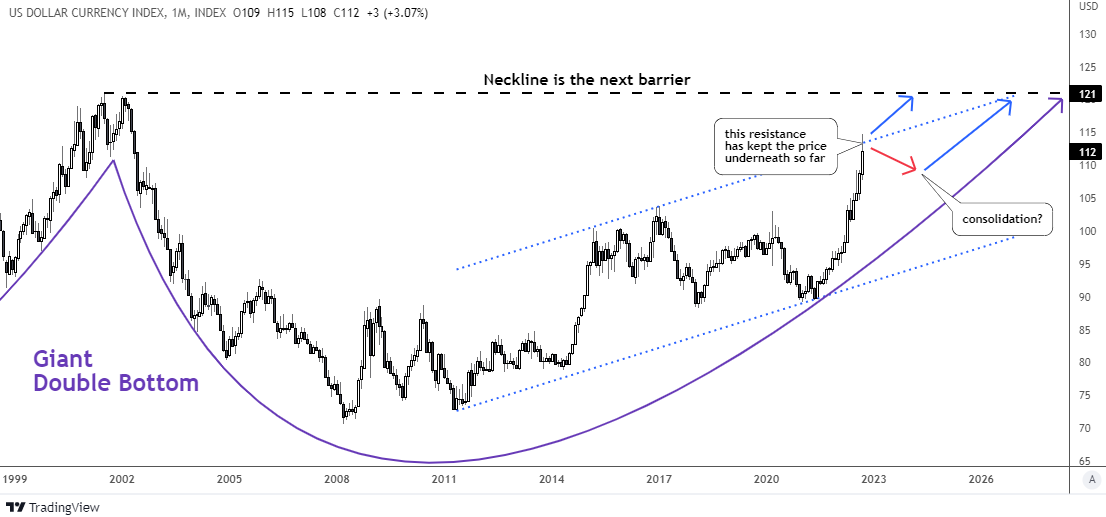
This chart above represents the right part of a Giant Double bottom pattern (purple). It emerges accurately as planned as the price is approaching the main barrier of the Neckline.
There is another crucial element in the chart, the uptrend channel (blue dotted). Recently, the price has pierced the upside of it above $114. However, the DX couldn’t consolidate the success and dropped back below the barrier to close the month’s candle underneath.
The price could take two paths from here. The continuation to the upside based on the aggressive tightening is the first option. Another option could put the market on the pause within a consolidation (red down arrow). The former is needed to let the market take a break and reflect on the consequences of the Fed’s actions. This path is not bearish as it is just one of the natural stages of the market to let the latter accumulate enough power for further growth.
The bearish scenario is not considered as the next target of $121 is closer than the first support at $100. That area has been shown in my earlier post. It consists of the simple moving average for the past one year and the large volume profile zone.
Intelligent trades!
Aibek Burabayev
INO.com Contributor
Disclosure: This contributor has no positions in any stocks mentioned in this article. This article is the opinion of the contributor themselves. The above is a matter of opinion provided for general information purposes only and is not intended as investment advice. This contributor is not receiving compensation (other than from INO.com) for their opinion.