Is Dollar's Dominance Over?

Last September, the Congressional Research Service published an "In Focus" report. They had already attempted to address speculation about the dollar's dominance in the face of global economic and geopolitical changes at the time.

Three major threats were addressed in that document.

China and its currency have risen to sixth place, accounting for 1.66% of global payments.

The next source of concern was US financial sanctions, as the share of Russian exports to Brazil, China, India, and South Africa in US dollars fell from 85% in Q2 2018 to 36% in Q4 2021.

Digital currencies, which include cryptocurrencies and digital currencies issued by central banks, have completed the list.

“Some policymakers have expressed concerns about an international race to create a digital currency with widespread adoption, arguing that the United States should create a U.S. digital currency to maintain the dollar’s prominence in international payments.”

"To date, there is no evidence of a shift away from the US dollar as the dominant reserve currency," the study concluded.

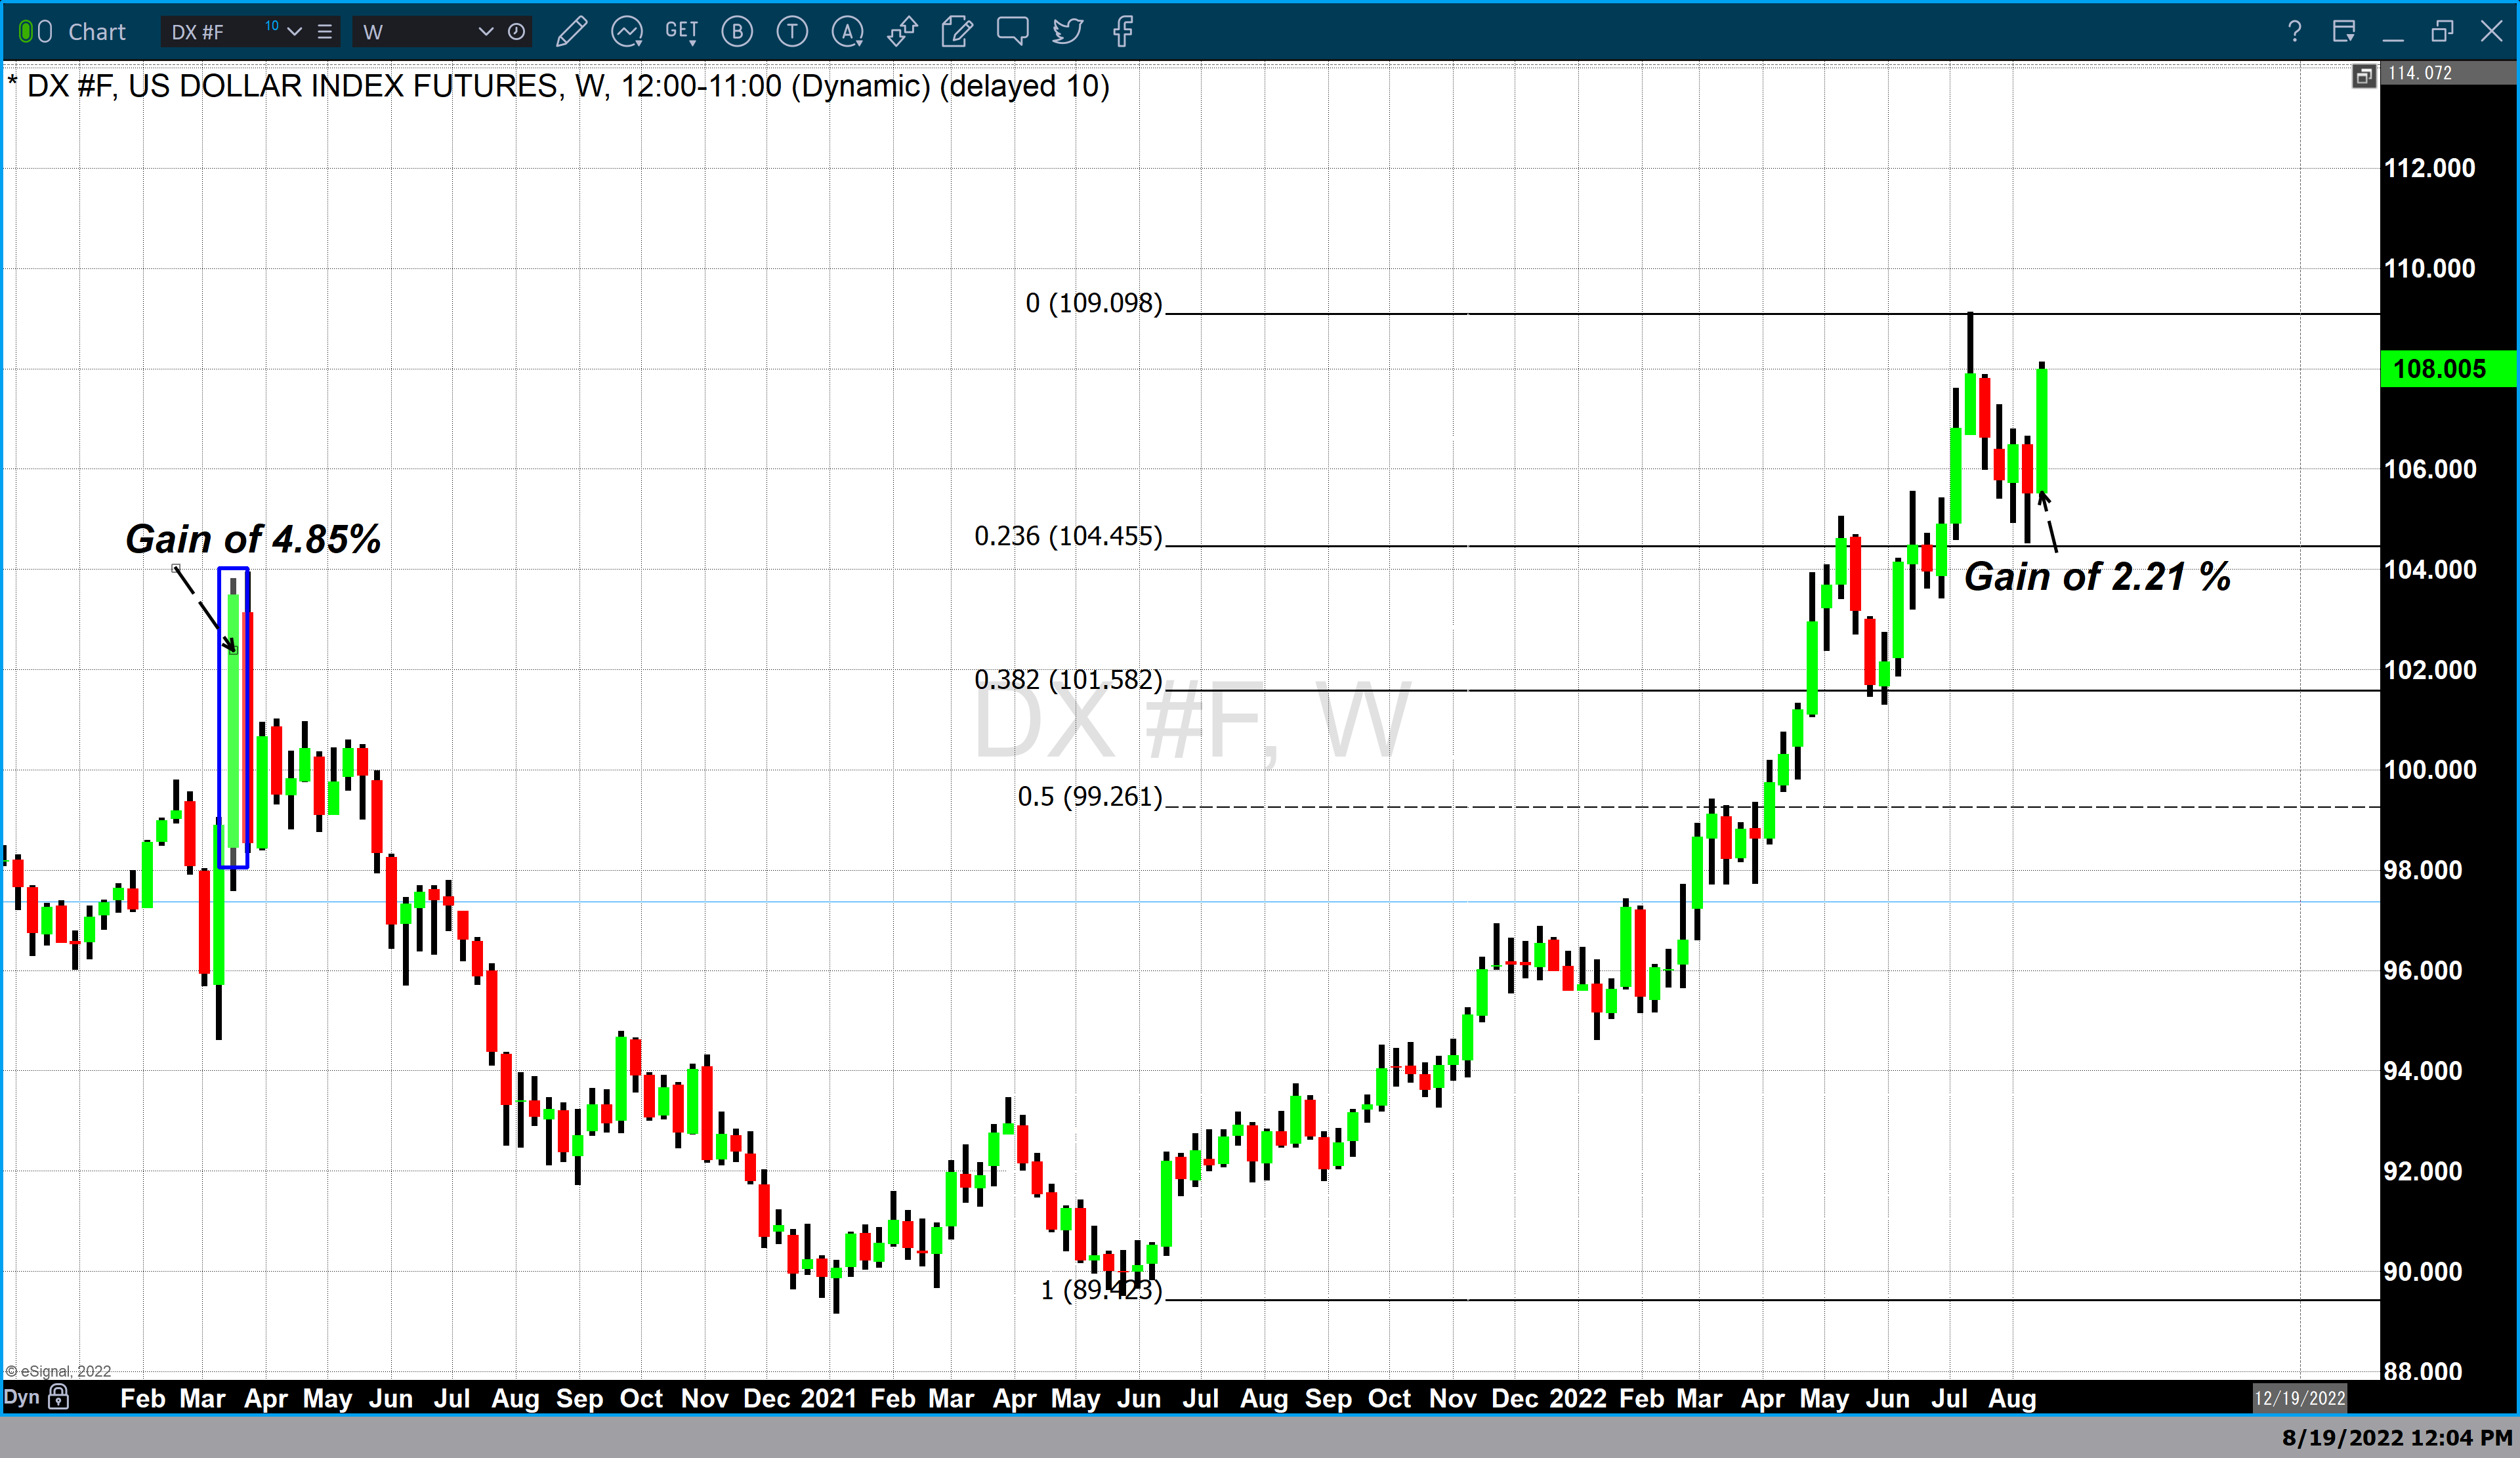
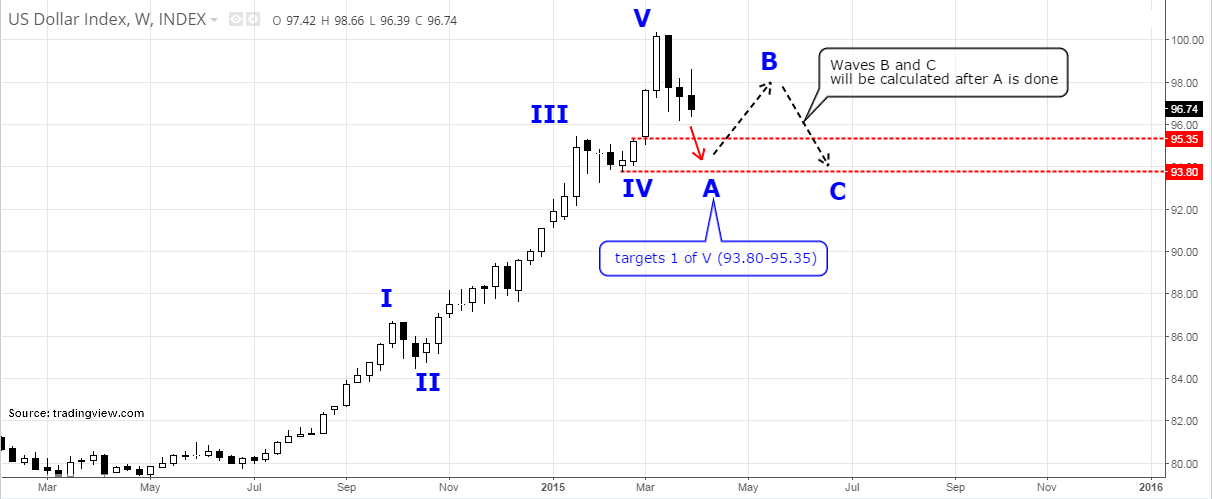
Back in October, I shared my most recent update for the dollar index, as it hit the first target with a fresh outlook.

At the time, I proposed two paths for the dollar: a continuation to the next target of $121 on an aggressively hawkish Fed, or a consolidation before resuming to the upside. The majority of readers supported both paths, with the consolidation option coming out on top.

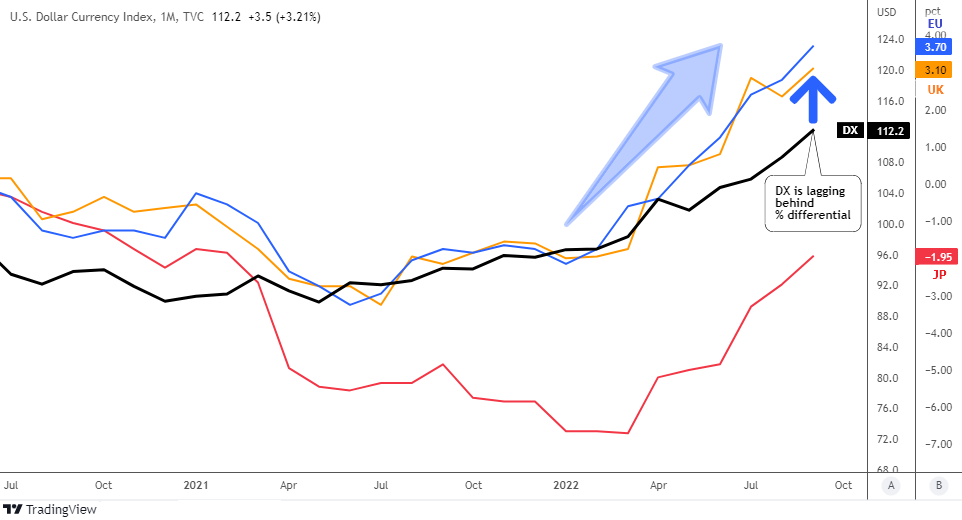
The question of the dollar's dominance is resurfacing these days, as its value has plummeted dramatically. It is too early to tell whether this is a consolidation or a global reversal.

One thing is certain: the path of unending growth has been abandoned.

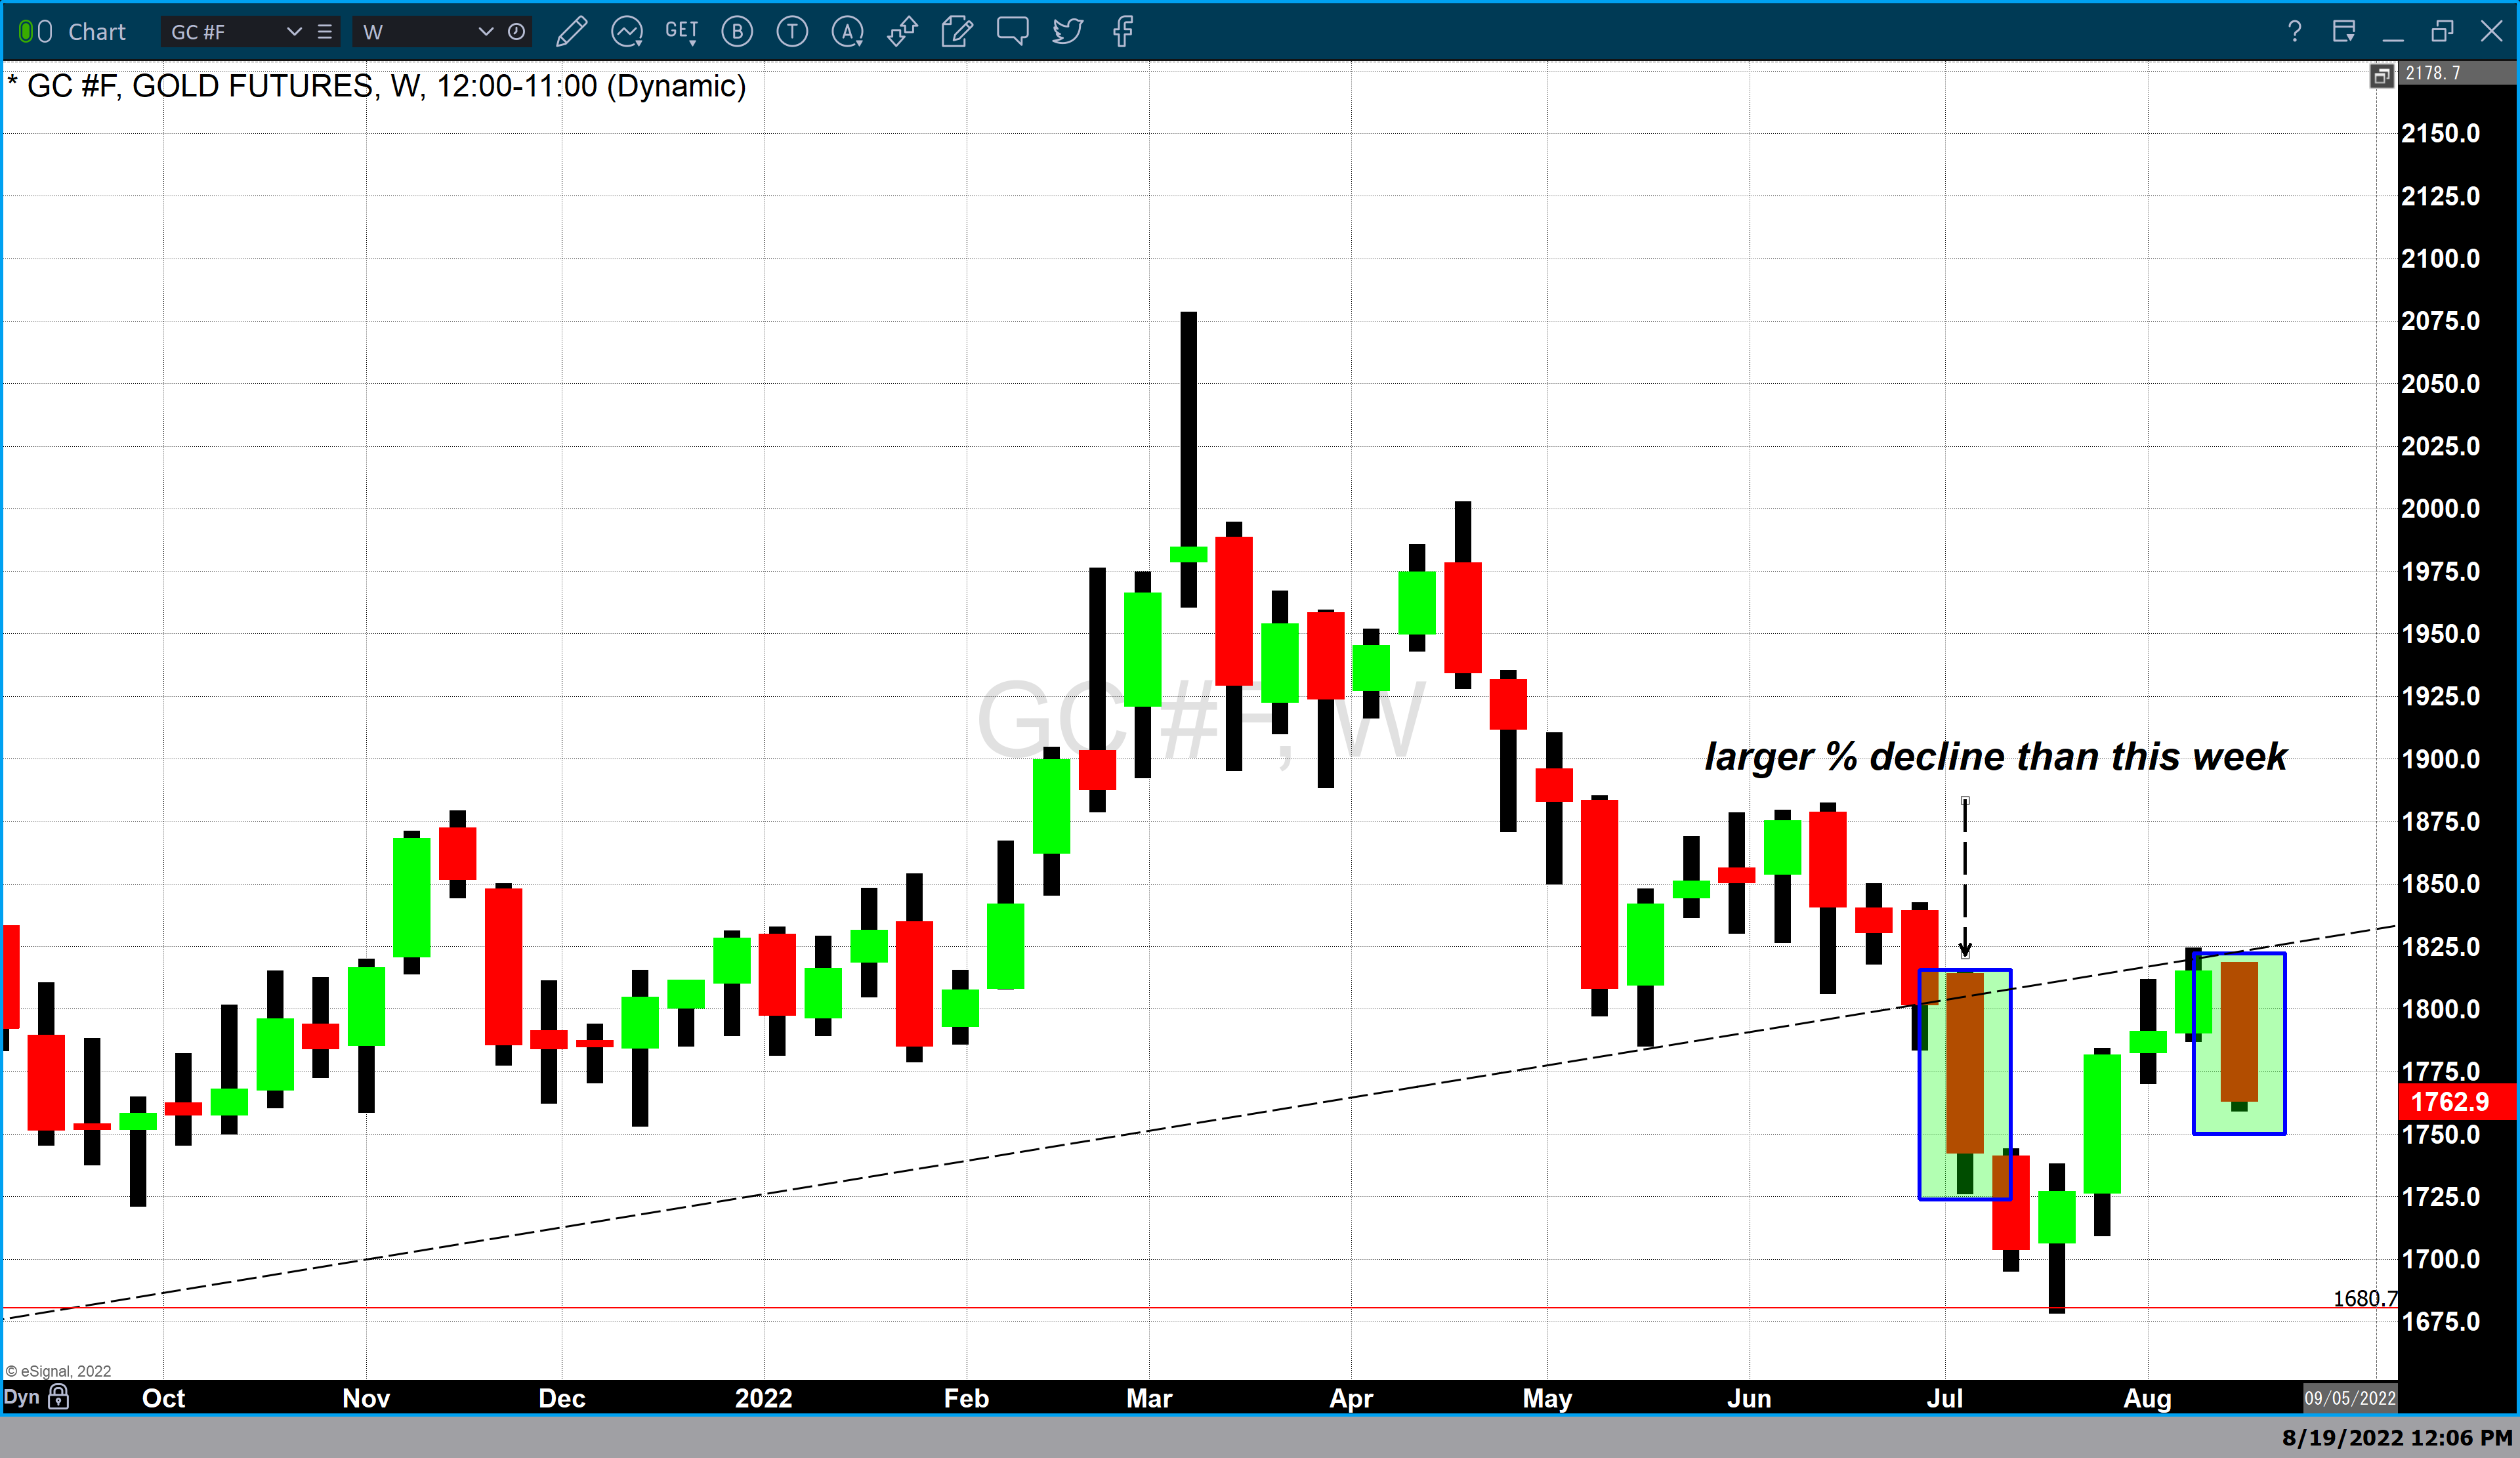
In my charts, I see a clash of perspectives. The technical chart is about to give a strong bearish signal. The chart comparing fundamental factors, on the other hand, supports the king currency's continued strength.

Let me show you each of them one by one, beginning with the emerging bearish alert. Continue reading "Is Dollar's Dominance Over?"

Inflation Continues To Spiral Higher

Key reports released last week in both the United States and the Eurozone revealed what global citizens have been acutely aware of. Inflation continues to spiral higher and at a staggering level.

This prompted Credit Suisse to issue a dire global economic outlook, saying that the “worst is yet to come”.

US Inflation Gauges

The Commerce Department released the latest inflation numbers vis-à-vis the PCE that revealed that the Core PCE jumped 0.6% in August. It shows that inflation is still intense and increasing.

The preferred gauge used by the Federal Reserve, the PCE (Personal Consumption Expenditures Price Index) revealed that inflation accelerated even more than expected in August. On a year-over-year basis, the core PCE which omits food and energy costs increased 4.9%, above projections of 4.7%. Continue reading "Inflation Continues To Spiral Higher"

The Dollar Has Hit The First Target

The king currency has finally hit the first long-term target of $114 that was set in the summer of a distant 2019 when it traded around $96.

That aim wasn’t clear then as the dollar index (DX) looked weak in the chart. The short-term structure was similar to a pullback after a heavy drop.

The majority of readers did not believe the DX would ever raise its head as you can see in the 2019 ballot results below.

Ballot Votes

However, I had found a bullish hint in a very big map, and I warned you “Don't Get Trapped By Recent Dollar Weakness”.

Back in August, you had already been more bullish on the dollar as you voted the most for the target of $121.3 in the earlier post. This confidence is due to the certain position of the Fed, which resolutely fights the inflation, lifting the rate aggressively round by round.

Let me update the visualization of the real interest rate comparison below to see if the dollar still has fuel to keep unstoppable.

DX Monthly vs Real IR

Source: TradingView

The real interest rate differentials are shown on the scale B: blue line for U.S. - Eurozone, orange line for U.S. – U.K. and the red line for U.S. – Japan. Continue reading "The Dollar Has Hit The First Target"

Dollar Strength VS Gold Weakness

Last Monday, August 15 gold opened at approximately $1816 per ounce and scored strong price declines over the last five consecutive days, characterized by four lower highs, and four lower lows taking the most active December contract of gold futures to $1760 with under a half hour of trading before closing for the weekend.

In a single week, gold lost $56 in value. Gold sustained a price decline of approximately 3.083% over the last five trading days.

Weekly Gold Futures Chart

This is significant but certainly not extremely rare. Historically speaking we can easily identify weeks in which gold had a significant drawdown greater than this week’s price decline. Only five weeks ago, during the week of July 4 gold sustained a weekly drawdown of $71. This represents a weekly price decline of 3.861%.

On the other hand, the gains last week in the dollar index are rare and I believe extremely significant.

Weekly DX Chart

In terms of percentage advance, gold did experience a larger percentage drop than the dollar gained. The weekly advance for the dollar index is 2.217%.

However, to identify the last instance the dollar declined this deep in a single week occurred during the week of March 16, 2020, well over two years ago. In a single week, the dollar index opened at 98.46 and closed at 103.48, a strong price advance of 502 points which is a weekly gain of 4.851% more than double last week’s gain. Continue reading "Dollar Strength VS Gold Weakness"

Gold Monthly Update: Hate The Dollar?

Aibek Burabayev - INO.com Contributor - Metals


The Dollar

In my last monthly update, I examined a chart of the US Dollar Index and today, I will do it again to show you how king currency rules this dollar-denominated world swing-to-swing. There is one difference; this time it will be an Elliott Wave analysis and I hope you will enjoy it.

US Dollar Index - 5 Targets / Waves A, B & C
Chart courtesy of Tradingview.com

As seen in the above weekly chart, right after my monthly post, the Dollar Index started its long-term correction, dipping below the Continue reading "Gold Monthly Update: Hate The Dollar?"