
Last week I promised to update the outlook for the U.S. interest rate, which has a strong impact on every asset class including precious metals.
More than a year ago I shared with you my concerns about the future of gold once the “era of rising rates” would come. The 10-year U.S. Treasury note yield (10Y) was at 2.2%, and large investment banks forecasted 3% yield for the near future at that time.
Indeed, that future has come in one year the 10Y is above the 3% now, and it doesn’t look like it’s the final stop. To see what could be the next I’ll share with you two charts starting from a short-term view.
Chart 1. 10Y Weekly: 3.33% And More
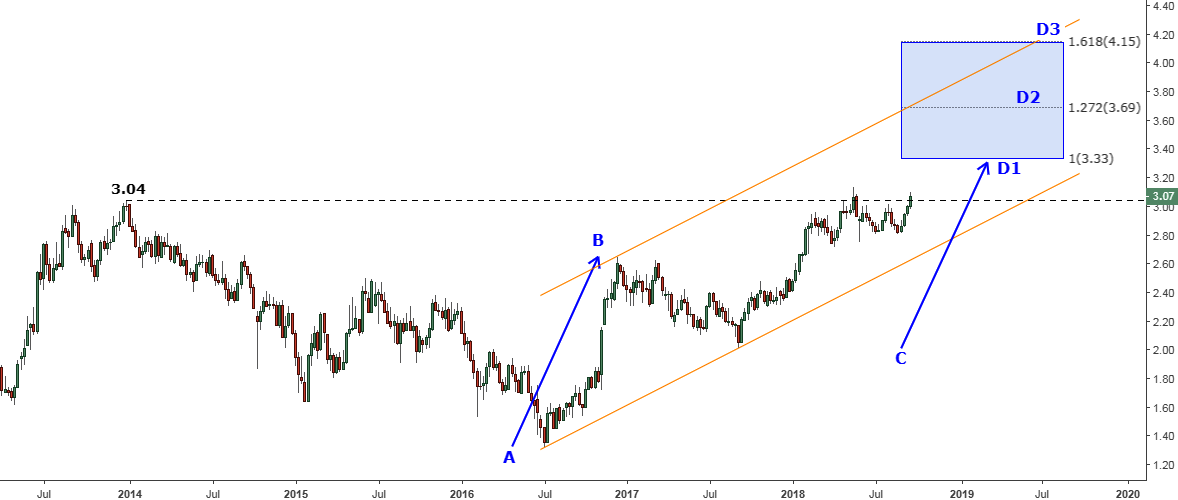
Chart courtesy of tradingview.com
This chart above observes the past five years to envelop the earlier top of 3.04%, which is under a second attack as the first one this past May couldn’t peg it. The yield closed last week at the 3.07%, and this time it could finally overcome the barrier to reach the target.
I highlighted two segments with blue up arrows for you to show the path of the future yield growth. The AB segment started in July 2016 from the 1.32% and then finished at the end of 2016 at the 2.64% doubling the yield. Therefore, the conservative target for the CD segment is located at 3.33% (CD=AB), which was marked as D1. Sometimes we can have an extension in the CD segment, according to Fibonacci ratios as highlighted in the chart above, where D2 (3.69%) is equal to 1.272 of the AB segment, and D3 (4.15%) is equal to 1.618 of the AB segment. The blue box covers all three targets for your visual comfort.
To complete the analysis, I added the orange uptrend channel to show you the path of this yield growth. Quite often we can see how trend channels confirm our assumptions based on the different analytical approach. This time there is another validation as the segment targets perfectly fit in the channel.
Now let’s move to the updated long-term chart, where we saw the threat of the rising rates for the first time more than a year ago.
Chart 2. 10Y Quarterly: Long-Term Resistance Was Broken
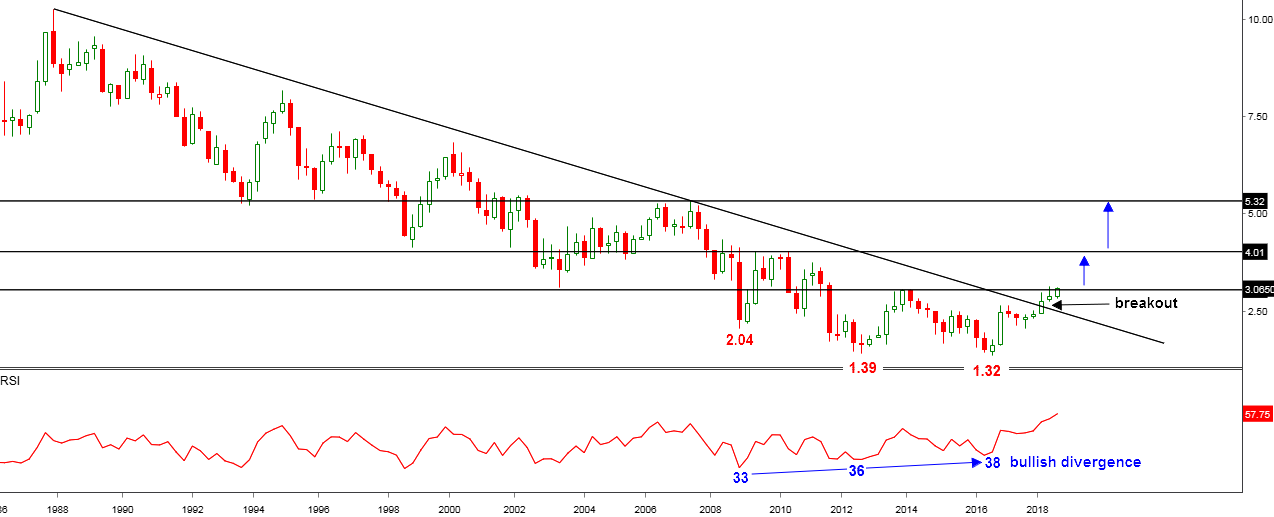
Chart courtesy of stooq.com
This long-term chart above spots the historical moment of the breakout, which occurred this winter and invalidated the 35-year-old move from the peak of 15.84% in 1981 down to the bottom of 1.32% in 2016.
Our regular assistant, the RSI indicator, warned us about the future reversal many years ago in the distant 2012 when another drop in yield from 2.04% down to 1.39% contradicted with the indicator’s higher valley reading (36 Vs. 33). The Bullish Divergence became even stronger when the last move down to the record low of 1.32% couldn’t make the RSI turn down. On the contrary, the indicator stubbornly pointed even higher than before to make a higher low at the 38 mark in 2016. You can see the consequences of this divergence right from the next quarterly candle after the bottom when the yield grew more than 1% just in one quarter.
As the yield is currently moving through the earlier top of 3.04% established in 2013, we should look further to the left part of the chart to find the next set of barriers for this unleashed beast. The closest one is located at the former top set in 2009 at the 4.01%, which requires the market to run for another 100 basis points (1%). This area corresponds with the D3 target described in the chart above.
Last month my respected fellow INO.com Contributor George Yacik shared the warning of the JPMorgan Chase CEO Jamie Dimon for us to be prepared for the 5% yield on the benchmark 10-year Treasury note. The top bankers usually voice forecasts of their best analysts and last year they were prophetic as we reached the forecasted 3% area in one year after the call. And this time we can find the predicted level in our long-term chart above at the 5.32% where we got lows of 1993, 1995 and the top of 2007. So it doesn’t sound insane considering the termination of the long-term downtrend.
Intelligent trades!
Aibek Burabayev
INO.com Contributor, Metals