
Every year ahead of Christmas I traditionally ask your opinion about the possible Santa Claus Rally in the precious metals market. Last time it was on the 10th of December. In that post, I shared my worries about the possible Grinch effect of the emerging strength of the US dollar (DXY index), which could spoil the rally at the end of the year.
Most of you believed that the Santa Claus Rally would happen despite the possible threat from the dollar’s strength. And like many times before you were absolutely right as both metals gained at the end of the year – gold’s price surged $50, and silver’s price jumped more than $1. Tremendous gains, bravo!
At the start of the New Year, I would like to update the medium term gold chart for you.
Gold Weekly: Three Options
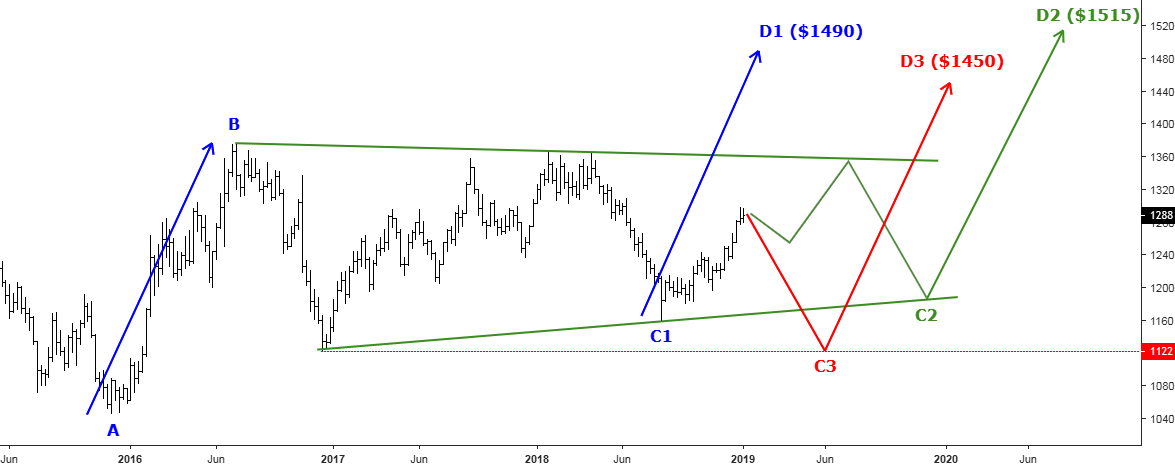
Chart courtesy of tradingview.com
The major structure of gold’s price is almost the same as in my February post. We should watch only after the establishment of a C point, which will be a threshold of another gold rally to finish this large consolidation. And this C point has 3 alternatives with 3 different D points accordingly, which I highlighted on the chart above for you.
In my November 2018 post the majority of you bet that the gold could have bottomed already and given the Santa Claus Rally that we witnessed. Recently I highlighted such an option to be the first on our chart above. The blue C1-D1 segment points in the $1490 level, where AB is equal to CD segment. This option implies further weakness in the stock market and the overall adverse scenario to emerge in risk assets.
The second alternative is shown for the first time in my charts. It implies the extended consolidation in the BC junction as the other move down failed to retest the former valley of $1122. This option means the prevailing uncertainty in the market, which could build another zigzag down after the limited move up within a large green Symmetric Triangle pattern. This would be a time-consuming alternative. The green C2-D2 segment then points in the $1515 level, but it should be corrected based on the fixed C2-starting point later on.
And the last one is the old option, which nevertheless is still possible. It means that the current extended move up would get exhausted soon and a further drop would follow to finally retest the former low of $1122 or even below. The preliminary position of the red C3-D3 segment points at the $1450 level, but we should update it once the price finds the bottom. This option implies the strength in the stock market as that hard drop we recently witnessed even if one would call it a correction was a scary one.
Intelligent trades!
Aibek Burabayev
INO.com Contributor, Metals
Disclosure: This contributor has no positions in any stocks mentioned in this article. This article is the opinion of the contributor themselves. The above is a matter of opinion provided for general information purposes only and is not intended as investment advice. This contributor is not receiving compensation (other than from INO.com) for their opinion.
Some historical studies is suggesting Bull run probabilities, however, to get any such rise, Gold must required to cross its's $ 1325 to $ 1360 resistance range, any bull probabilities can be expected only after achieving after such break-out. otherwise, we may found lower levels around $ 1150 or even bellow that mark.
Harry Dent said to sell all of your gold .. What is your opinion?
harry dent has since changed his opinion, as even he now realizes that gold will be going to the moon. the fed and big banks are about to lose their grip on fake manipulated precious metals market thanks to trump and china. when that happens you will see the real and true value of gold.
Just listened to harry, December 28, 2018. He has definitely changed his gloom and doom forecast on gold, no more $450/$700. Now its flat to down for the next couple of years, possibly going back to $1050/$1000. I noticed he is waffling a lot more than usual. He is not so certain about gold's near term future (2 years out) Long term he expects another bull market, which makes sense, based on the apparent 30 year cycle, top to top. (one cycle is not much to go on) Harry is short term bullish on the dollar and the stock market, so that means money is not going to go into gold, so it most likely with drift down while the dollar and the market goes up. Since we need to unwind the debt accumulated over the past 30 years or so the more obvious path for now is higher dollar, lower gold. You don't pay down debt with gold. Most worldwide debt is in dollars.
Curious observation. If you look at a log chart of $GOLD, you see that its trading right up at the upsloping resistance trendline from the bottom in late 2015 to the present, and that RSI is very near the top of the range. The chart looks like a picture perfect backtest of the decline through the trendline back in June, 2018.
https://www.booktrakker.com/Economy/GoldTrendline.jpg (I own this domain)
Thanks,
Andy