
Silver has failed to complete the second leg up as it couldn’t break above the August top of $15. It is interesting that this misbehavior of the white metal didn’t surprise you as the majority of you had bet last week that silver would fail and drop below $14.2. It’s impressive how accurate your forecast was!
In this post, I would like to update downside targets as we should be prepared for the resumption of the drop in metals after pullbacks have been finished.
Chart 1. Gold Weekly: Bear Flag Targets Bottom
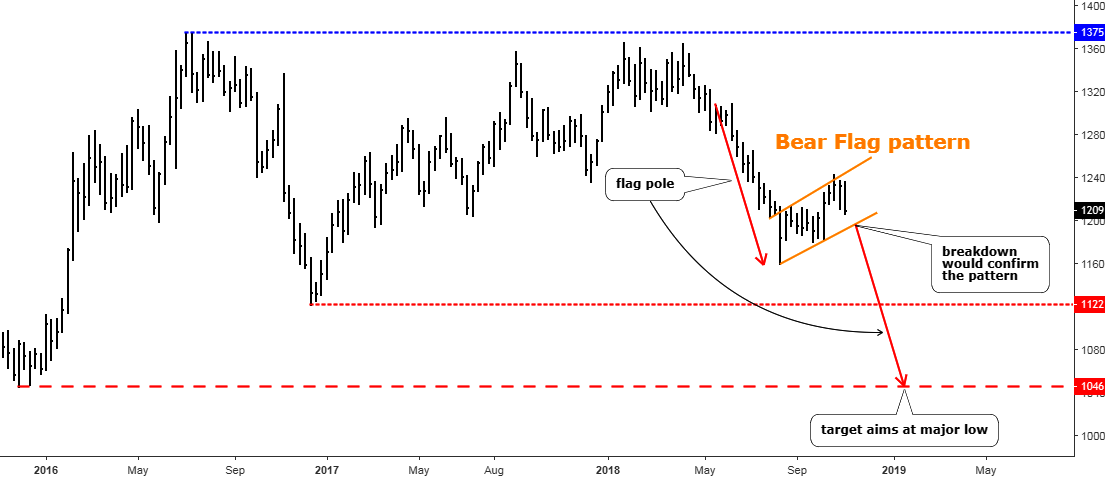
Chart courtesy of tradingview.com
Last week I reminded you of the big range of trade, which requires the retest of the downside of the range to complete the setup.
In this post, I highlighted for you a famous Bear Flag pattern (orange), which is yet to be confirmed. The break below the downside of the flag ($1190) is pending to complete the pattern. The first red down arrow represents the Flag Pole, which is crucial to calculate the target of the pattern. Another red down arrow shows the path to the target.
There are two interesting things about this pattern. Firstly, the target implies the breakdown of the range’s trough of $1122. Secondly, the target coincides amazingly with the major low of $1046, which was established three years ago in December of 2015. Again and again, we see the magic of math that frequently appears on the charts. Let’s see, which model would play out in the market.
Chart 2. Silver Weekly: Falling Knife
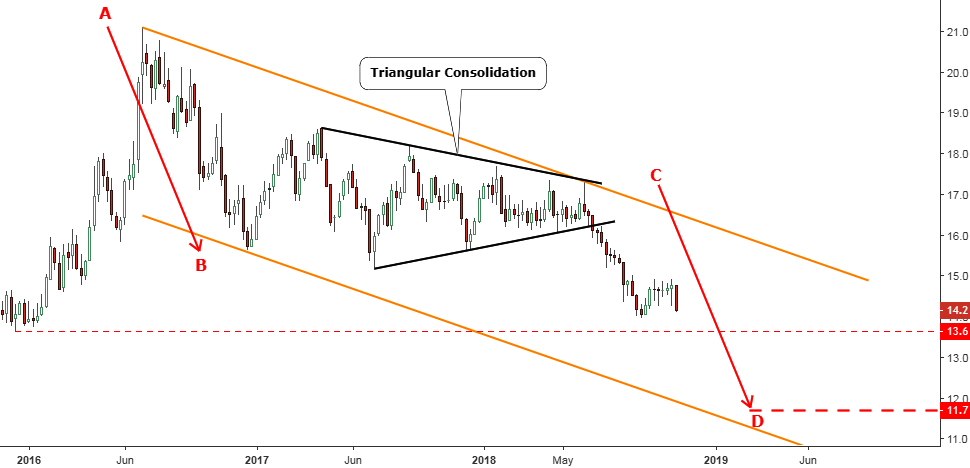
Chart courtesy of tradingview.com
Silver looks like a younger sister, who lacks parents’ love in favor of elder sister Goldie. It lacks investors’ support, therefore, it couldn’t perform the same size of the pullback as gold did and the subsequent drop was just horrific. The price closed only 20 cents away from the September low as one single weekly candle erased almost all gains established in the past two months. Indeed, there is a falling silver knife.
This is an update of the chart I posted this past May. The main concept is still valid, and the AB segment remained unchanged. The triangular consolidation has extended its width, and that caused the change of the angle of the downtrend channel (orange) to cover the top established this June, which is now a lower point for the start of CD segment. This amendment has moved the target of D point also lower from $12.3 down to $11.7. The new target is far below the major low of $13.6.
Before you bet on the silver’s bottom, I would like to share with you one more chart of the gold/silver ratio as it can expand your current view.
Chart 3. Gold/Silver Ratio Daily: Gold Keeps Stronger
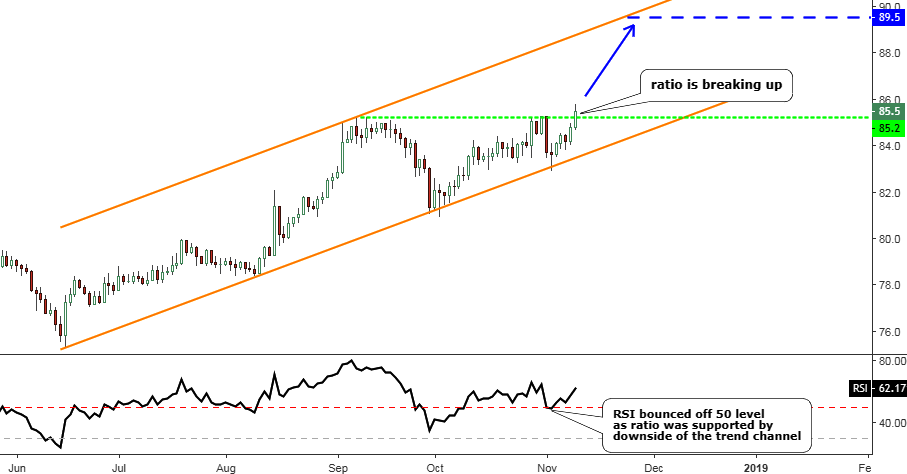
Chart courtesy of tradingview.com
The ratio is rising for the second year in a row with small consolidations in between. The angle of growth turned even steeper than in a previous year. The orange uptrend’s downside was tested several times this year but kept intact. The last attack down was conducted at the beginning of this month, and we can see that both price and the RSI on the sub-chart bounced off the support to keep the gold’s dominance.
The ratio finally broke above the green horizontal resistance of 85.2 troy oz. last Friday and closed at 85.5 troy oz. The target is located at the top of the channel of 89.5 troy oz. And now let’s use this target level to check where the silver could drop if gold hits the Bear Flag’s target of $1046. If we divide 1046 into 89.5, we will get $11.7 for silver, and it’s a target for the CD segment. Simple math, but it’s incredible!
Last time the bets were split evenly between the two metals.
Intelligent trades!
Aibek Burabayev
INO.com Contributor, Metals
Disclosure: This contributor has no positions in any stocks mentioned in this article. This article is the opinion of the contributor themselves. The above is a matter of opinion provided for general information purposes only and is not intended as investment advice. This contributor is not receiving compensation (other than from INO.com) for their opinion.
I have lost over 70 thousand in Silver coin investments due to high cost and broker fees. I am totally disgusted with corrupt brokers taking people's funds on phony excuses etc. I could name two companies investors need to stay away from as these are the ones that stole my wife's and my silver investment.
Since long, From Gold's Chart, out of most of Analysts, some of them are either searching Bullish trend probabilities or some others are busy to find out Bearish trend chances, but unfortunately none of them found any satisfactory outcome of their study.
Considering above situation, I would like to focus on a "Neutral" Probability that Gold may found caught in a Mid or even for Long term "Side-way" move, in which, neither it cross upper range of $ 1200 to $ 1350 nor break it's lower range between $ 1200 to $ 1050. So Gold may trade in between above given upper to lower range or around $ 1250 as a mid-value zone for a long long long while.
However, above probability is purely based on, and subject to the condition that Geopolitical situation must be remain stable without any major or significant changes, and if happened so, in that changed situation we will require to get fresh study accordingly.
Stronger dollar from FR rate hikes will continue to repress metals and oil.
So whats your thots
Beats me but as a supposed industrial metal in the electronic area this weakness could be an indicator of Mfg weakness going frwd