
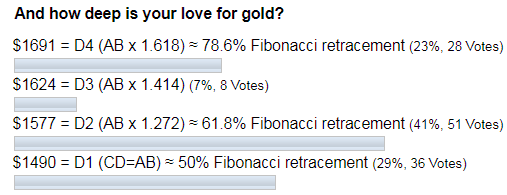
On the 6th of January, gold had hit the second target of $1577 that I showed you last June when we measured the depth of gold bugs love. I will update the big chart for you below to show why this second target is crucial. By the way, this target was the most favored then as you can see in the graph of ballots below.
It’s a real miracle that we witnessed the Santa Claus Rally again this year. I updated the short-term chart for gold right ahead of Christmas as I thought the correction would extend itself to delay the rally for a later period. The invalidation point for the bearish scenario was set at $1516 as the price moved almost $100 above that point for someone’s benefit.
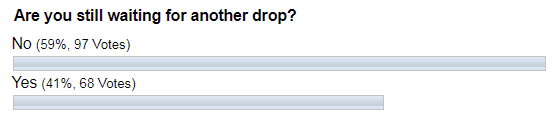
Most of you voted for the immediate rally as you didn’t expect another drop, and you were amazingly right, again!
I think it’s time to check big charts to adjust our short-term navigation plans.
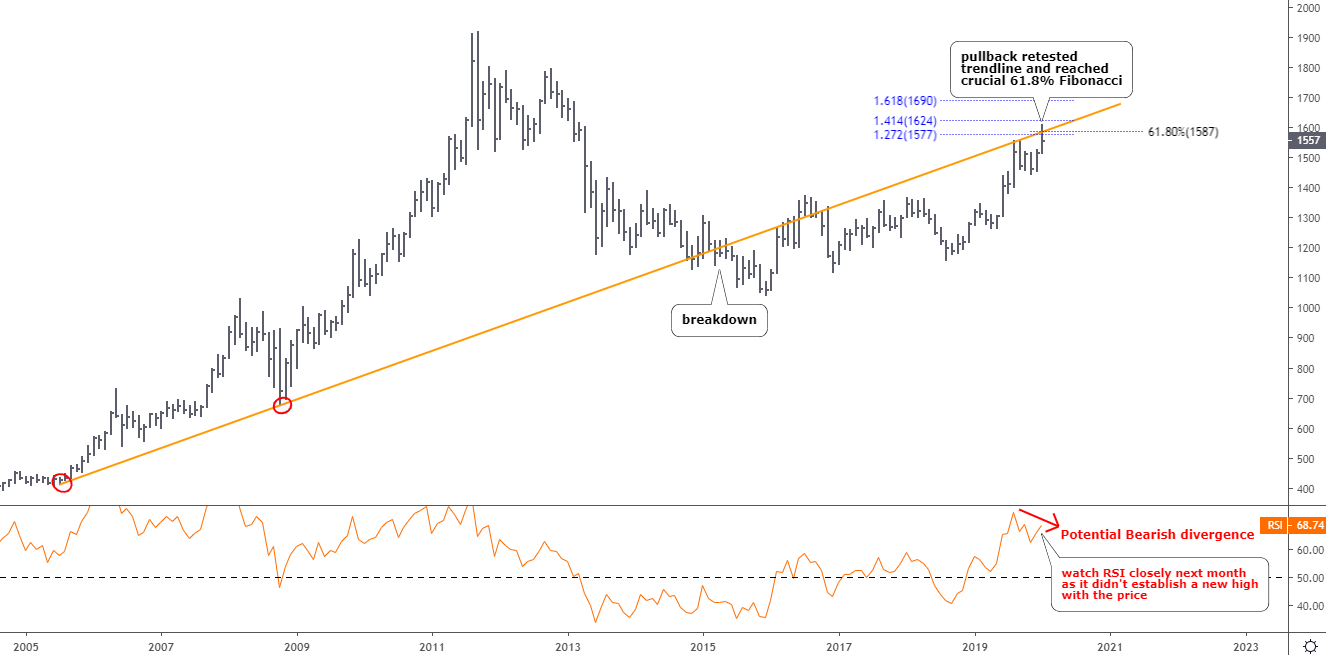
Chart courtesy of tradingview.com
This is a standard monthly chart above with a virtue of simplicity. I shared it with you last August when the price hit the first target of $1490.
Gold is still in a significant pullback that consists of two legs up. The second target coincided with a contact point of the second leg of a pullback around the $1580 mark. Besides that, it amazingly intersected with a 61.8% Fibonacci retracement level and moreover, it was between the 1.272 and 1.414 Fibonacci ratios for the second leg.
The question is whether it was enough for this pullback to unfold as it perfectly retested the broken orange trendline and reached the critical 61.8% Fibonacci retracement level. The future will tell it for sure. In the summer of 2016, we already saw how the price managed to throw over the broken trendline by almost $80 when the first leg to the upside unfolded. Such a jump could be enough to reach targets #3 at 1.414 ratio ($1624) and #4 at 1.618 ratio ($1690).
The RSI has shown the first alarming signal. The recent rally didn’t establish a new high for this indicator as it did on the price scale. The month is yet to finish, so watch it carefully to see if gold can update the indicator’s maximum. The RSI divergence is not the selling signal itself; it just warns us of an upcoming change in the trend. Another price maximum could still be established ahead of a reversal to make the divergence more visible as long as RSI is above 50.
Let’s continue in the weekly chart for more details.
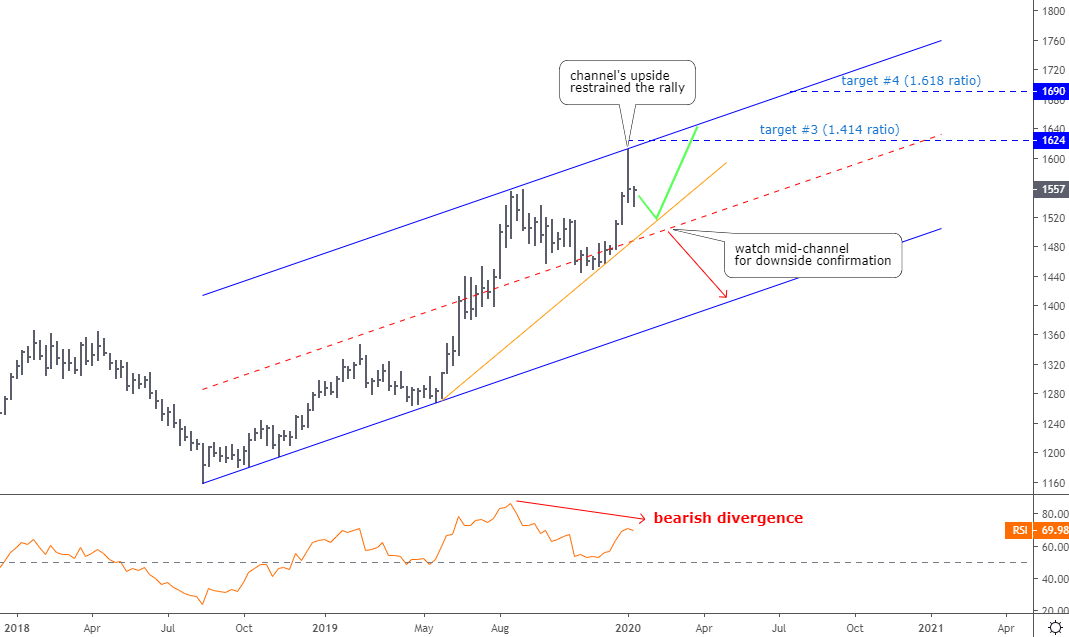
Chart courtesy of tradingview.com
This weekly chart perfectly displays the power of the trends. As we can see, the upside of the blue uptrend channel restrained the recent gold rally to the tick as the price reversed right on the line.
I added targets #3 and #4 on the chart for you to visually feel the possibility of the gold price to hit it. In my opinion, the overall structure of the whole second leg of pullback, which is contoured with a blue uptrend channel, has more chances to reach target #3 rather than target #4.
Currently, the price is in a correction, which could reach the orange trendline support in the $1515-1520 area. And then, the last move up fueled with euphoria could break out to reach the target #3 (green zigzag) to exhaust there.
I switched on the mid-channel (red dashed) for you to see the border where the downside move could start.
The RSI on the weekly time frame already shows the Bearish Divergence as lower peaks on it contrasts with a higher high on the price chart. The breakdown below the 50 level would initiate the reversal to the downside along with the capitulation of the mid-channel support, but it is yet early to ring that bell.
Intelligent trades!
Aibek Burabayev
INO.com Contributor, Metals
Disclosure: This contributor has no positions in any stocks mentioned in this article. This article is the opinion of the contributor themselves. The above is a matter of opinion provided for general information purposes only and is not intended as investment advice. This contributor is not receiving compensation (other than from INO.com) for their opinion.
Al, I think the $USD will have something to say about the price of gold as it often done. Do a 1 year chart on this very chart. I'm watching for a drop to 96 (gold continues up for a while) and then a rally in the dollar to 98 (gold has a correction) to form a second shoulder for a reverse head and shoulder pattern. Once that happens is when we will see a real rally in both gold and silver.
If true, the dollar should just about be running out of steam any day now. I am a "pattern weenie".
Just my opinion.
Dear Ron, I illustrated my opinion about the Dollar Index (DXY) last June (https://www.ino.com/blog/2019/06/dont-get-trapped-by-recent-dollar-weakness/) as I warned to not get trapped by recent dollar weakness. You could click on https://assets.ino.com/img/sites/ino/email/10673.jpg to see the monthly graph. I think the dollar will be stronger supported with the positive interest rate and safe haven status in this unstable world. Currently the DXY bounced off the 96 area and if it gets over 100 then further strength is expected, which is negative for the gold.
I tailored a weekly chart for you at https://www.tradingview.com/x/2hYvLwLv/ so you can see my view there. We all read patterns but using different instruments.
Just my opinion either )).
Best wishes, Aibek
The USD is just one of the macro-economic drivers of the gold price and it is by no means the most important one. In fact, if you look at gold vs. the dollar in recent years, there is simply nothing in sight that could possibly be interpreted as a fixed correlation. Sometimes they are negatively correlated, sometimes positively... there is no rhyme or reason to it, and above all there is no regularity whatsoever. That is also why gold is at all time highs in practically every major non-USD currency.
I would actually recommend to ignore the USD and focus on the things the market seems to care about, such as real interest rates (best gauged by looking at 5-year TIPS yields), which were the by far strongest macro-driver of gold for the past 20 years.
Dear Mr. Tenebrarum,
I prepared the visualization of correlations between different instruments including your proposal in your comment at
https://www.ino.com/blog/2020/01/visualizing-correlation-gold-vs-other-instruments/.
I hope you enjoy it.
Best regards, Aibek
gold having a small following,compare to the other markets and being influenced and traded at a touch of a key with information being delivered across the continents, its hard to look at commodities as a investment compare to the 70s when you had time to respond to news. I traded commodities for years always made money,for which i can say is a achievement. i observed hundreds and hundreds of people from all walks of life loose, even if they entered at the right time.!! now as i see the markets in today's circumstances i will say its much harder to make a living or become a winner. i use the gold market and invest it mining stocks. this gold market is scary, can drop 500 dollars in the blink of a eye!! every one is on the front of the boat.I hope i am wrong." market action invariably discounts the news " Humble trader i surrender.
follow the herd and go down with the ship.
News decreasing geopolitical uncertainty.
Great stuff. Al.
Dear Al, thank you very much for your support. Best wishes, Aibek